hello@datalabsagency.com
logo
Datalabs Agency
En
  • De
  • Ar
2
logo
  • Data Training
    • Our Six Main Workshops
      • Introduction to Data Visualization: Tools & Techniques Workshop
      • Designing Great Business Dashboards Workshop
      • Infographics & Report Design Workshop
      • Creative Data Presentations with PowerPoint
      • Visual Storytelling for Government Workshop
      • Creative Power BI Dashboard Design
    • Online Courses
      • An Introduction to Data Visualization & Storytelling
      • Designing Great Dashboards
  • Data Design
    • Style Guides
      • Power BI Style Guides
      • Tableau Style Guides
    • Animated Data Videos
    • Maps & Cartography
    • Interactive Infographics
    • Power BI Dashboards Designs
    • Tableau Dashboards Designs
    • Infographic Reports
    • Interactive Data Visualizations
    • Digital Annual Reports & Microsites
  • Case Studies
  • Shop
    • Ecommerce Products
      • Power BI Templates
      • Power BI Theme and Style Guide
      • An Introduction to Data Visualization and Storytelling Course
      • Designing Great Dashboards Course
      • Data Visualization Consultant
  • Login
  • Contact
    • About
      • Otto Ottinger
      • Blog
0
تحليلات تسويق المحتوى: الشروع في العمل ، وتعديل استراتيجيتك
08 January 2015
Elon Musk quote: "Failure is an option here. If you are not failing you are not innovating enough." 0
When Failure is Just a Hallmark of Innovation
05 March 2015
تحليلات
تقرير انفوجرافيك البيانات الضخمة
January 22, 2015 by Datalabs in تحليلات

تقرير انفوجرافيك البيانات الضخمة

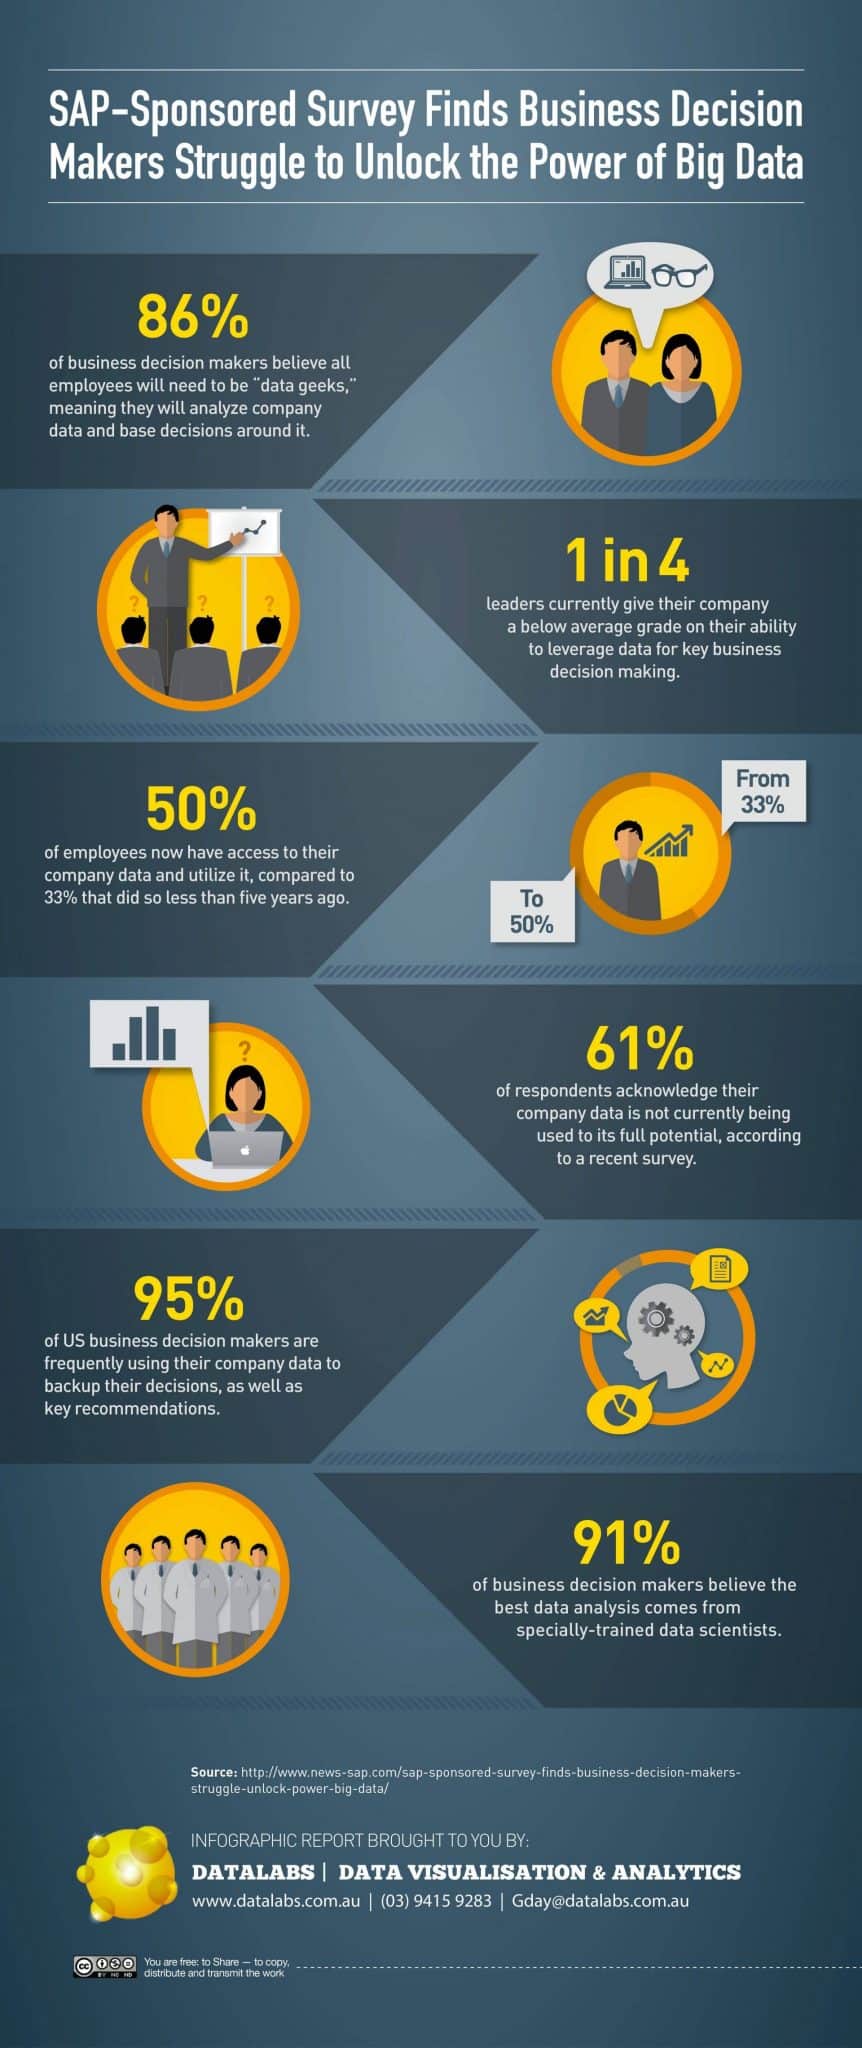
وجد تقرير حديث صادر عن SAP أن ما يسمى بقوة البيانات الضخمة لم يتم فتحها بعد من قبل صانعي القرار.

صممت Datalabs تقريرا إنفوجرافيكيا ، تصور النتائج.

تقرير إنفوجرافيك البيانات الضخمة والتحليلات

0 Comments
  • البيانات الكبيرة
  • التحليلات
  • التقارير المرئية
  • الرسوم البيانية
  • نسغ
0 Like!
Share
Datalabs

Data Visualization Training: Workshops & Courses

Shop Online for Data Visualization

  • Image of a man using our Power BI templates to design a report
    Power BI Templates
    Select options
  • Image of our custom Power BI Theme on a computer
    Power BI Theme and Style Guide
    Select options
  • An Introduction to Data Visualization and Storytelling Course
    An Introduction to Data Visualization and Storytelling Course
    Add to cart
  • Photo of a data visualization consultant advising clients and helping solve design issues.
    Data Visualization Consultant
    Buy product
  • Designing Great Dashboards Course
    Designing Great Dashboards Course
    Add to cart

Style Guides for Data?

A photo of our data viz style guide for Microsoft Power BI

Data Visualization & Storytelling Group Workshops

Contact Us

  • This field is for validation purposes and should be left unchanged.

From Our Blog

  • 8 unglaubliche Beispiele für interaktive Datenvisualisierung
  • 8 أمثلة لا تصدق من التصور التفاعلي للبيانات
  • 8 Incredible Examples of Interactive Data Visualization
  • Data Analytics Konferenzen 2024 & 2025
  • مؤتمرات تحليلات البيانات 2024 و 2025
  • Data Visualization Training
  • Brand Guidelines for Data
  • Online Courses & Products
© 2025 Data Arts Pty Ltd
logo