hello@datalabsagency.com
logo
Datalabs Agency
En
  • De
  • Ar
0
logo
  • Data Training
    • Our Six Main Workshops
      • Introduction to Data Visualization: Tools & Techniques Workshop
      • Designing Great Business Dashboards Workshop
      • Infographics & Report Design Workshop
      • Creative Data Presentations with PowerPoint
      • Visual Storytelling for Government Workshop
      • Creative Power BI Dashboard Design
    • Online Courses
      • An Introduction to Data Visualization & Storytelling
      • Designing Great Dashboards
  • Data Design
    • Style Guides
      • Power BI Style Guides
      • Tableau Style Guides
    • Animated Data Videos
    • Maps & Cartography
    • Interactive Infographics
    • Power BI Dashboards Designs
    • Tableau Dashboards Designs
    • Infographic Reports
    • Interactive Data Visualizations
    • Digital Annual Reports & Microsites
  • Case Studies
  • Shop
    • Ecommerce Products
      • Power BI Templates
      • Power BI Theme and Style Guide
      • An Introduction to Data Visualization and Storytelling Course
      • Designing Great Dashboards Course
      • Data Visualization Consultant
  • Login
  • Contact
    • About
      • Otto Ottinger
      • Blog

Projects

Home
Filter by:
Categories
  • Animation
  • Infographic
  • Software Design
  • Workshop
Authors
  • Datalabs
  • Otto Ottinger

Data Visualization Projects

Examples of Our Work

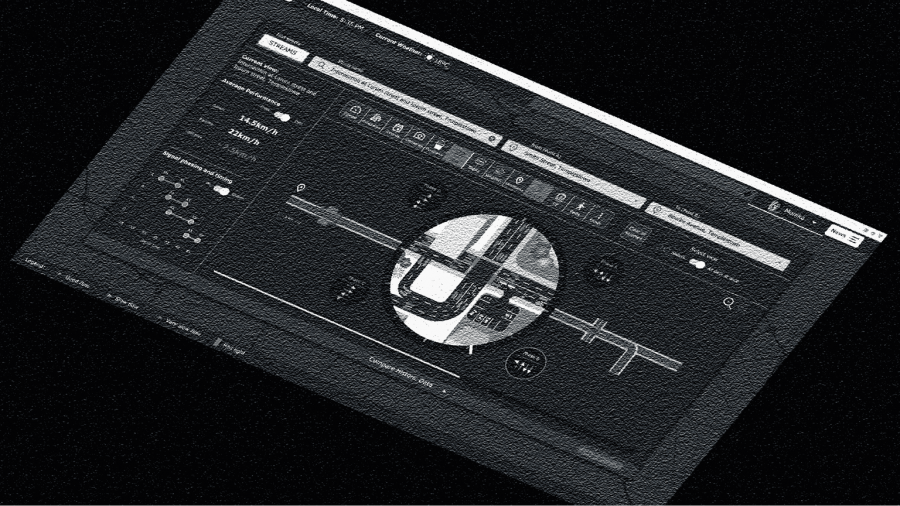
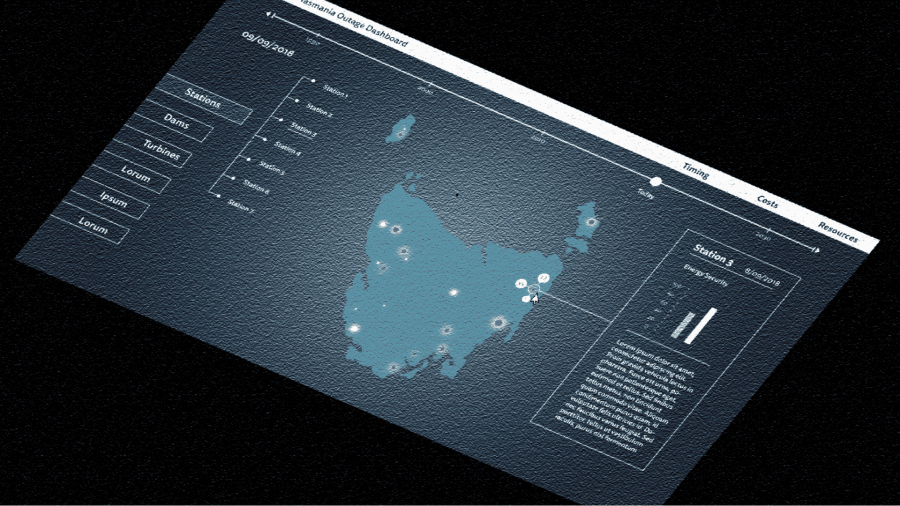
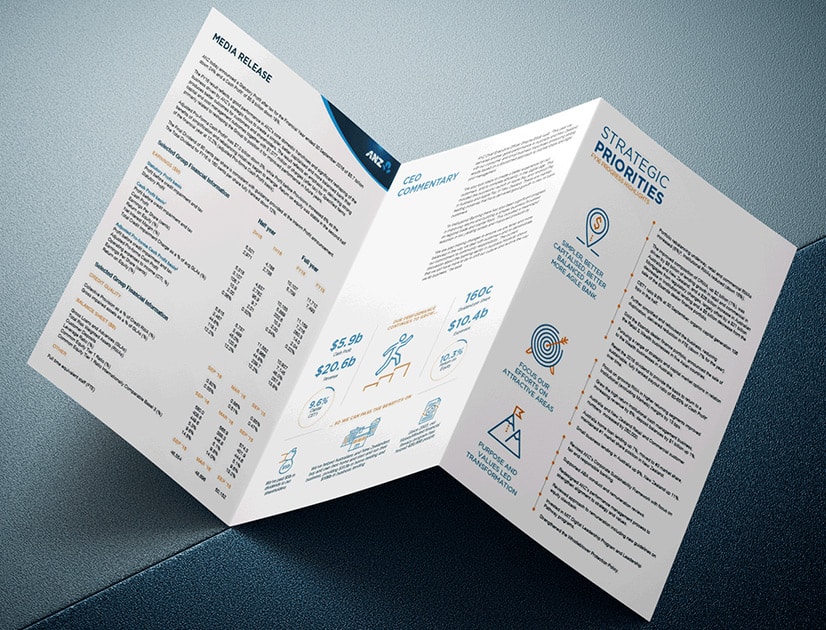
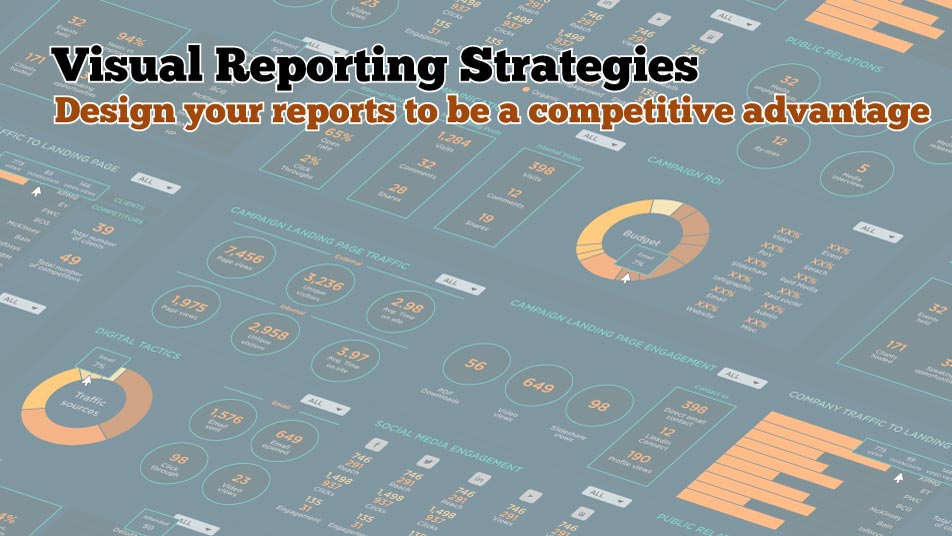
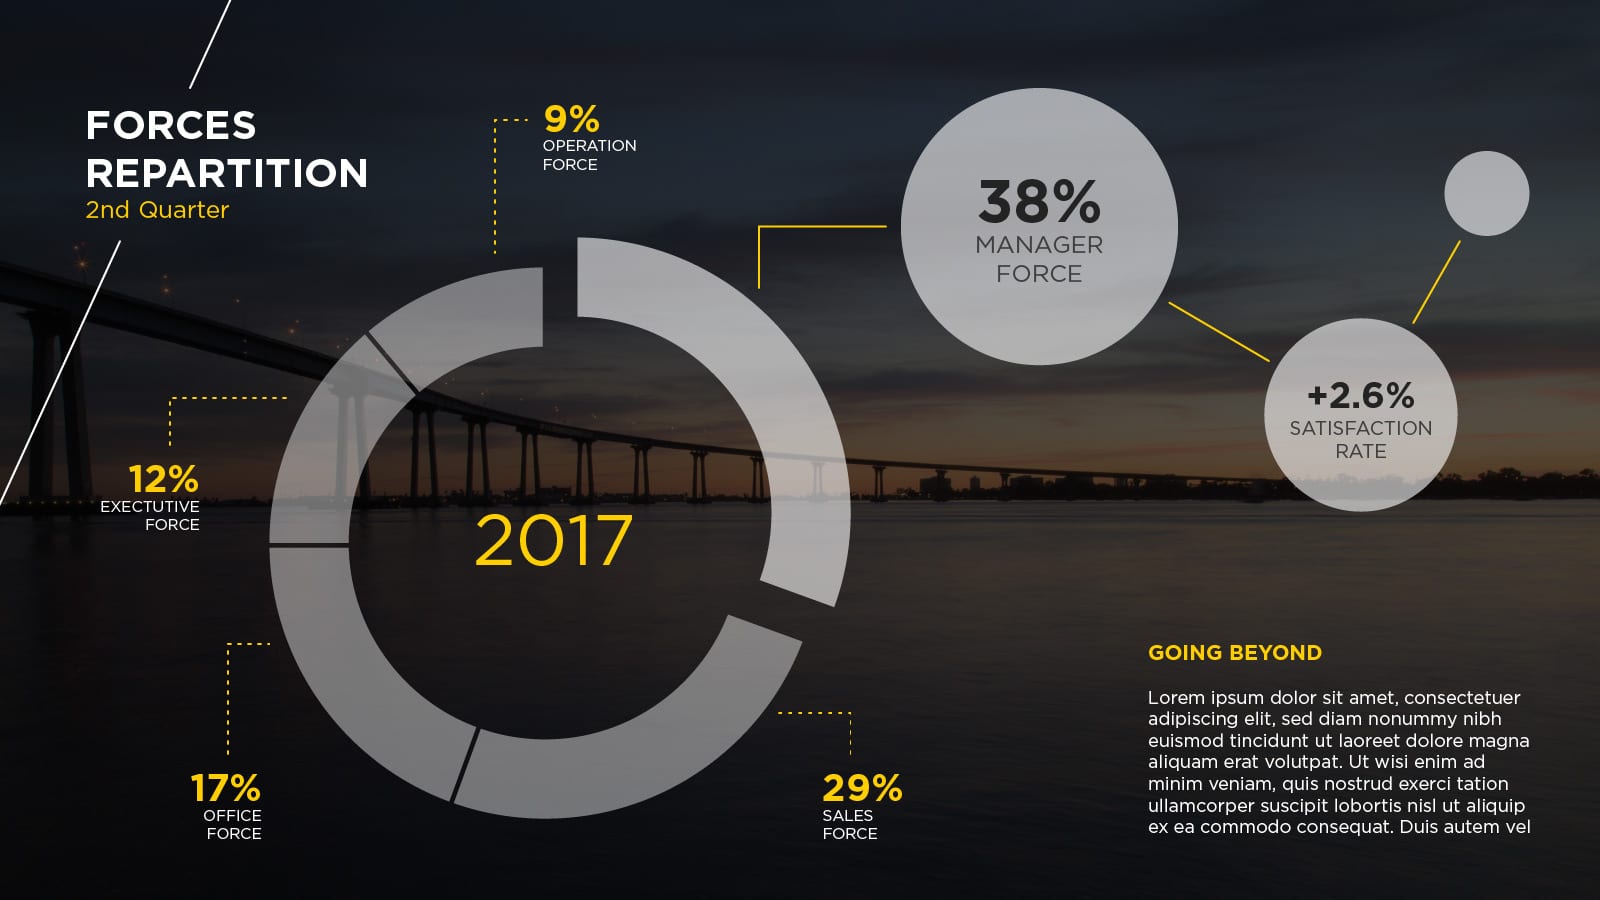
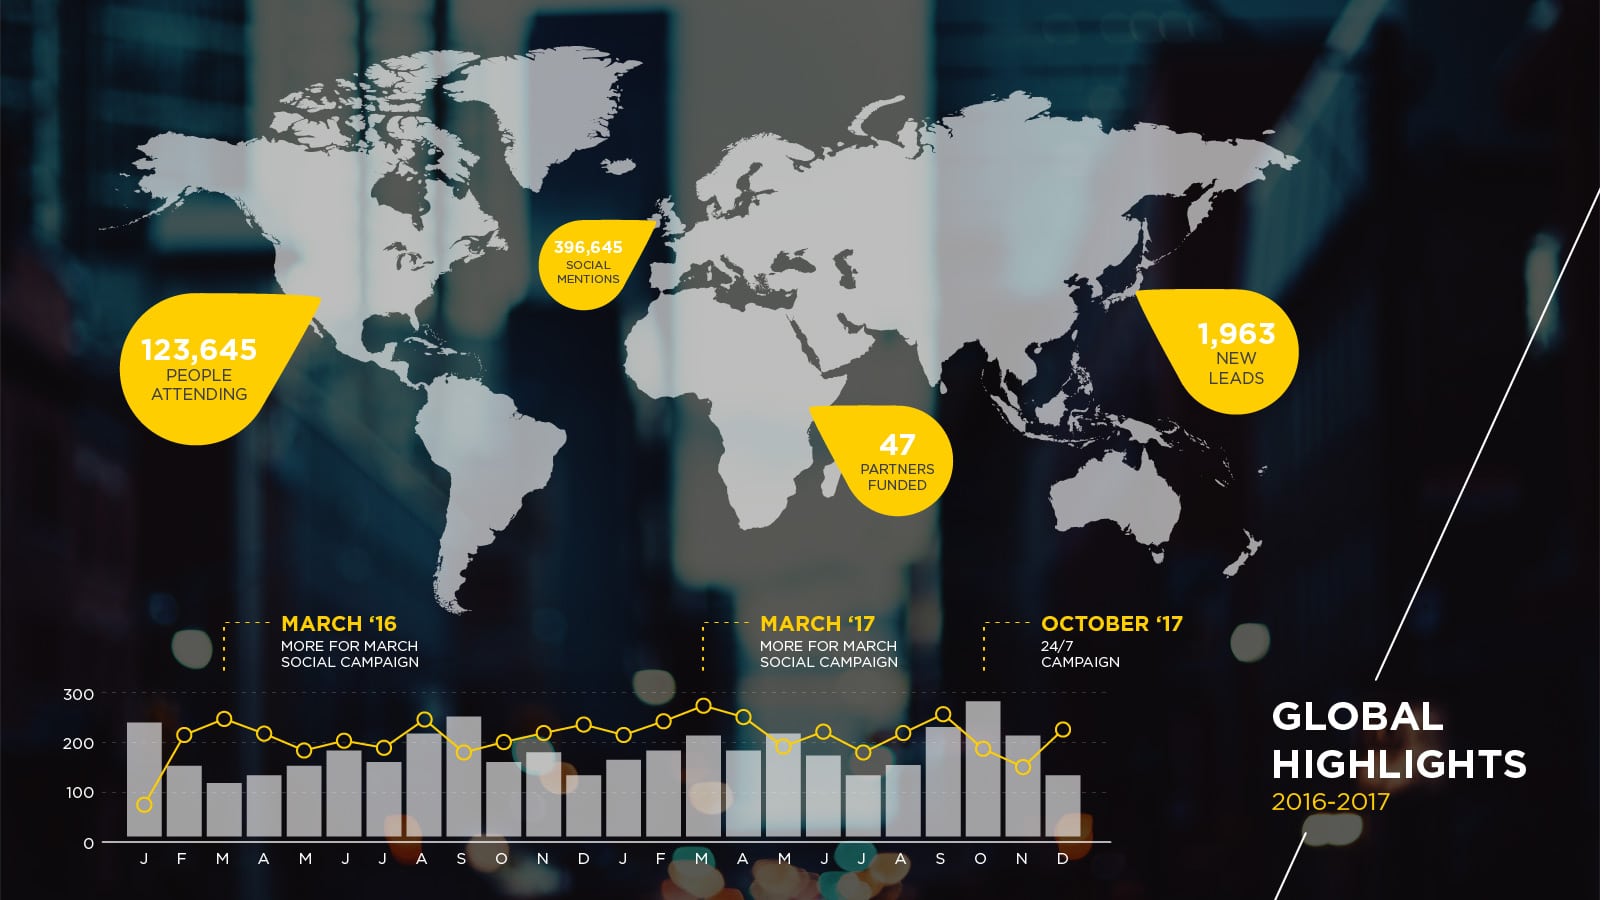
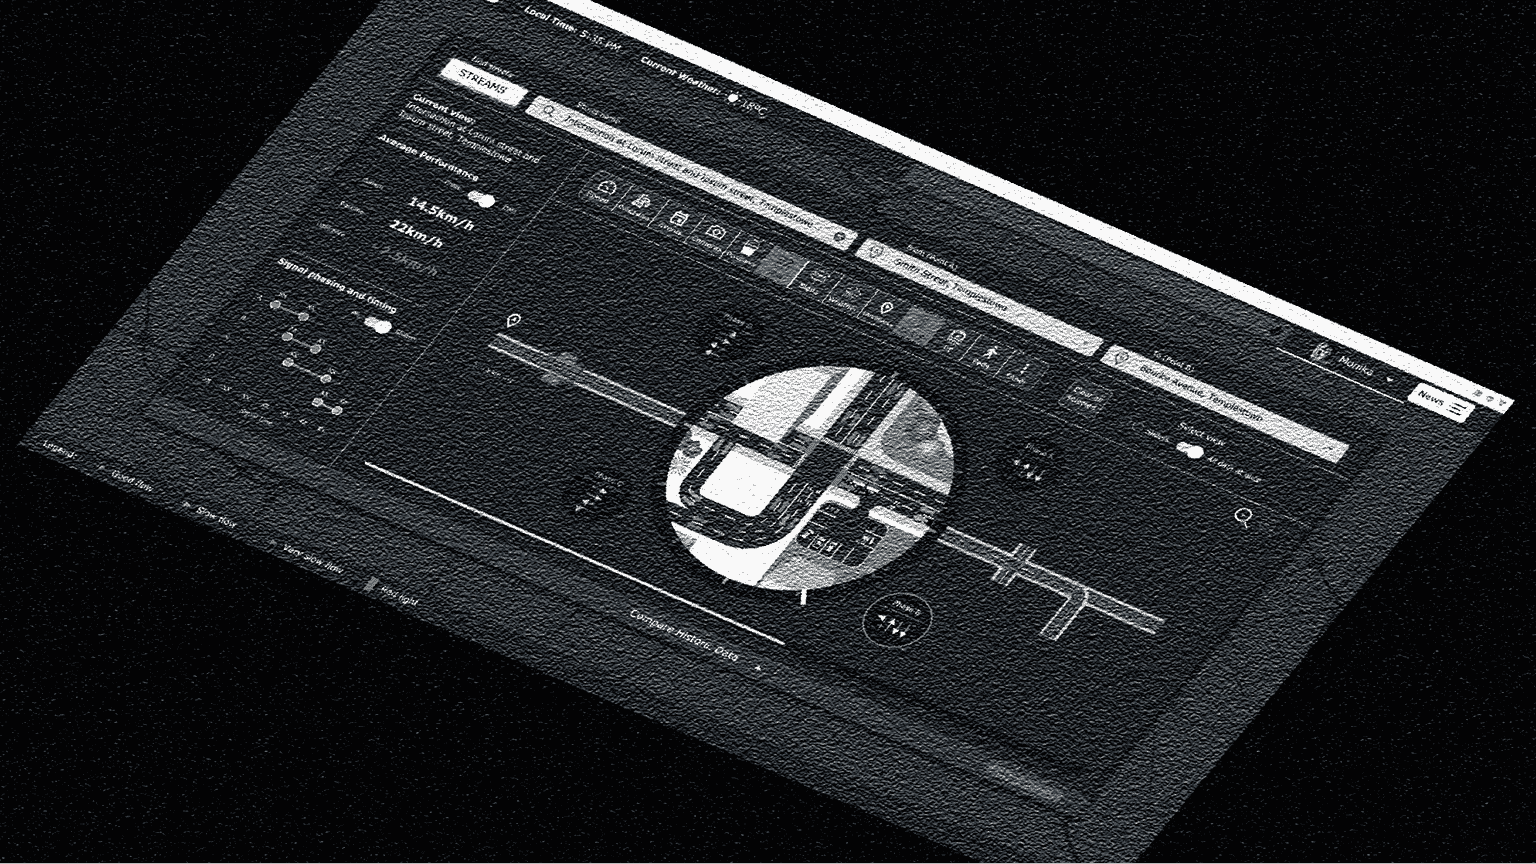
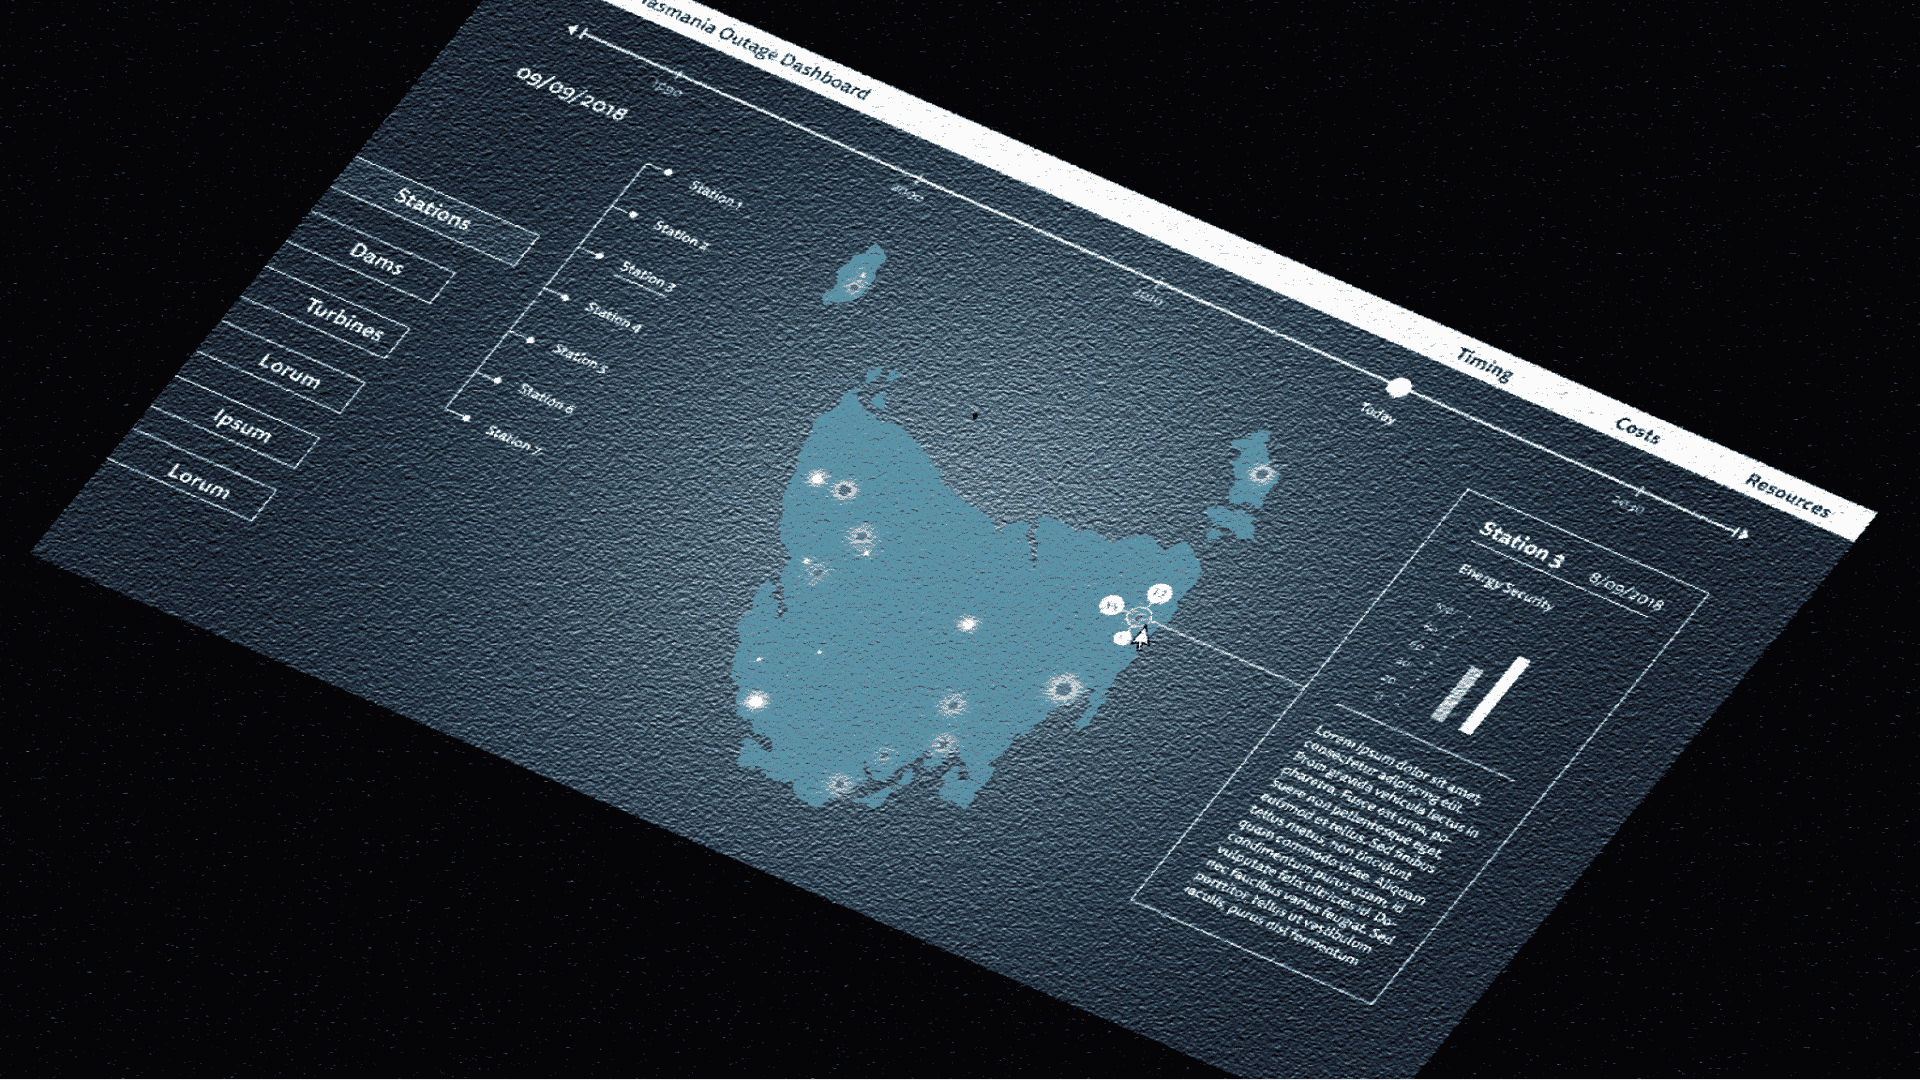
Below you’ll find a whole lot of our data visualization work. From data infographics, reports & interactive visualizations all the way through to animated data videos and reporting microsites.

Online Data Viz Workshop for UPS
0
0 Like!
Online Data Viz Workshop for UPS
More
Share
Infographic and Data Visualization Workshop for Al Jazeera
0
0 Like!
Infographic and Data Visualization Workshop for Al Jazeera
More
Share
Traffic Management, IoT and XAI Software Design
0
0 Like!
Traffic Management, IoT and XAI Software Design
More
Share
Hydroelectricity Asset Management Portal
0
0 Like!
Hydroelectricity Asset Management Portal
More
Share
Animation and Infographic
Mauris mollis risus
0
0 Like!
Animation and Infographic
More
Share

Data Visualization Training: Workshops & Courses

Shop Online for Data Visualization

  • Image of a man using our Power BI templates to design a report
    Power BI Templates
    Select options
  • Image of our custom Power BI Theme on a computer
    Power BI Theme and Style Guide
    Select options
  • An Introduction to Data Visualization and Storytelling Course
    An Introduction to Data Visualization and Storytelling Course
    Add to cart
  • Photo of a data visualization consultant advising clients and helping solve design issues.
    Data Visualization Consultant
    Buy product
  • Designing Great Dashboards Course
    Designing Great Dashboards Course
    Add to cart

Style Guides for Data?

A photo of our data viz style guide for Microsoft Power BI

Data Visualization & Storytelling Group Workshops

Contact Us

  • This field is for validation purposes and should be left unchanged.

From Our Blog

  • 8 Incredible Examples of Interactive Data Visualization
  • Data Analytics Conferences 2024 & 2025
  • Data Visualization & Design Conferences 2024 & 2025
  • Case-study: Intranet Dashboard Design for Nestlé
  • Dashboard Tips: 3 Alternatives To Using A Data Table
  • Data Visualization Training
  • Brand Guidelines for Data
  • Online Courses & Products
© 2024 Data Arts Pty Ltd
logo

We noticed you're visiting from United Kingdom (UK). We've updated our prices to Pound sterling for your shopping convenience. Use United States (US) dollar instead. Dismiss