Sale!

Power BI Theme and Style Guide

An all-in-one package containing tools, guidance, and assets to design great dashboards

$900$3,900

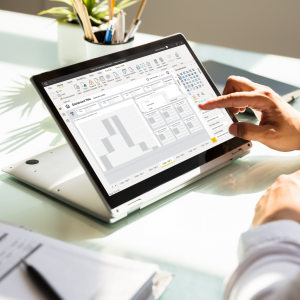
A visual Power BI theme (together with its JSON file) is the first step to go from good BI to great BI. It’s also the missing link in most business intelligence projects. When you work on any visual platform having a guide with parameters, styles, assets, rules, and examples is key to a smooth process and a clear style. Add to that the complexity of conveying a story with data or using the interface to show complex systems, then without a guide, it means that there is no consistency.

Clear
Share

Description

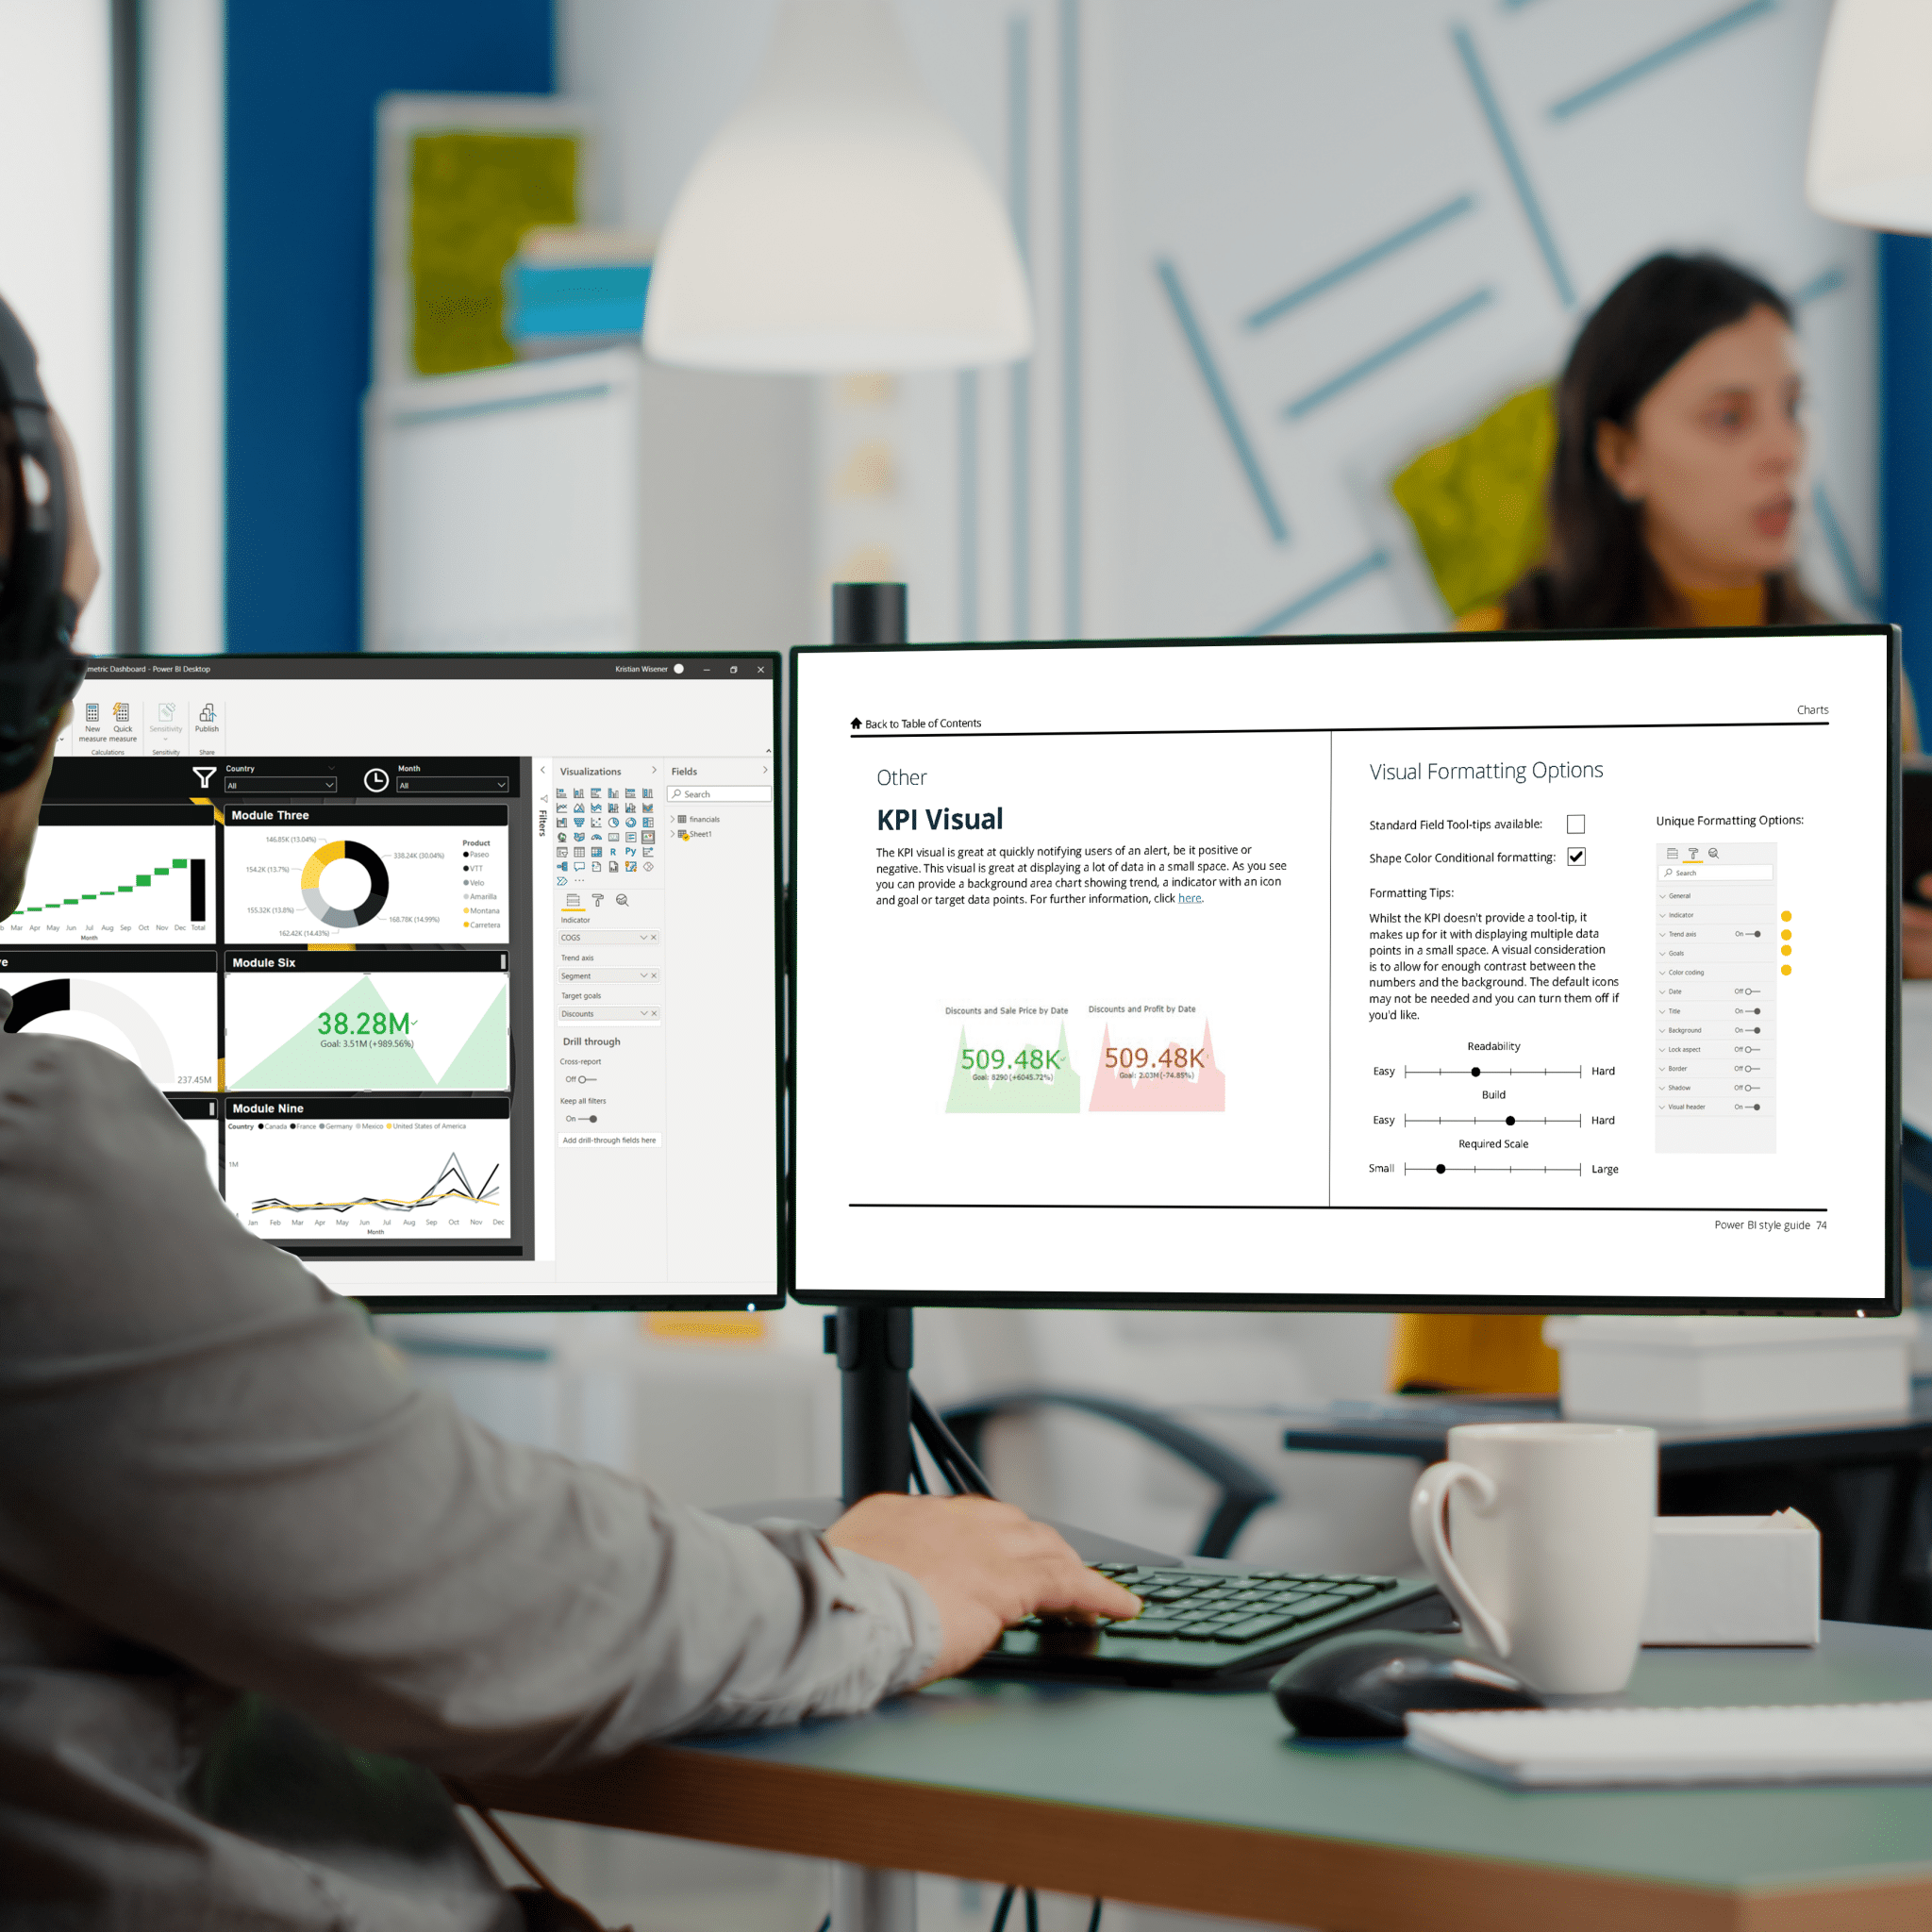
ABOVE: Hit play for a sneak peak at our Power Bi dashboard style guide. 

More Than Just Styling

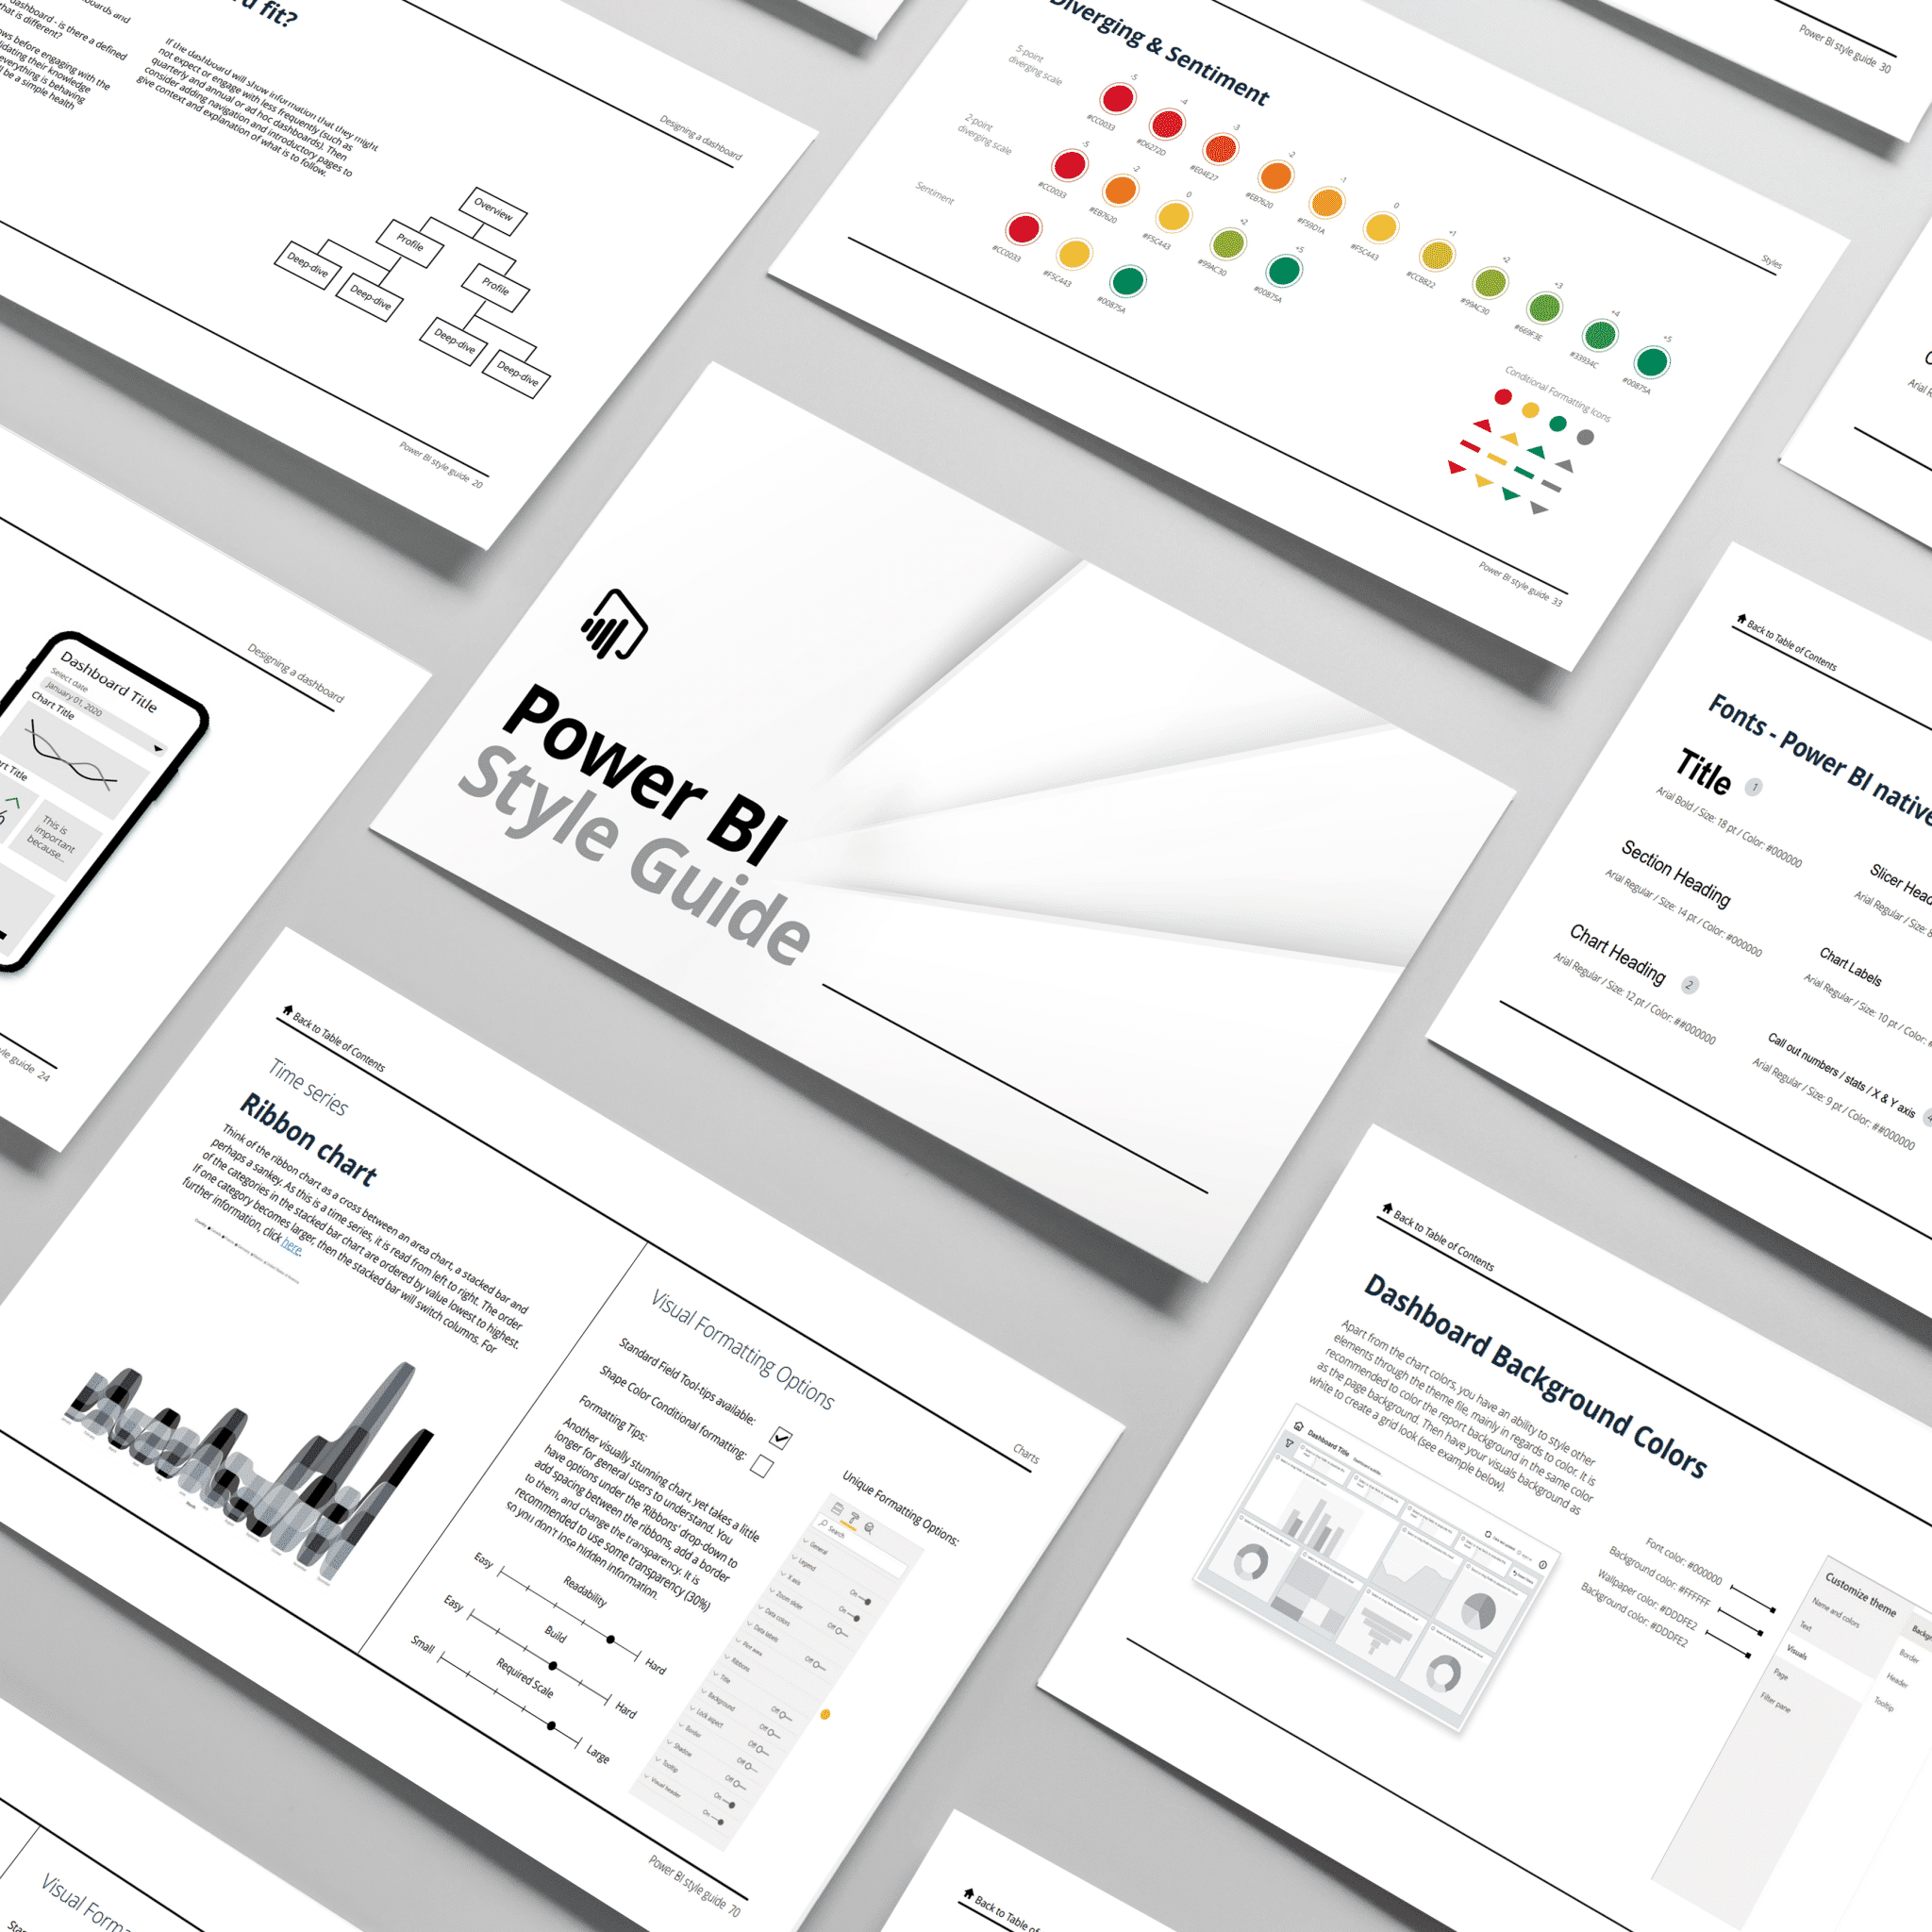
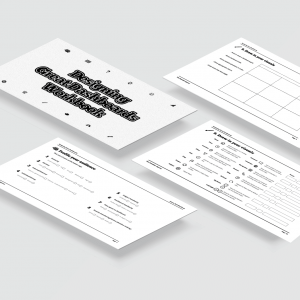
Read up on dashboard design theory, interact with pre-built Power BI charts, check off design process lists, and learn what each unique chart has to offer.
Power BI Training Icon: Learn Creative Data Visualization and Dashboard Design

Power BI Charts?

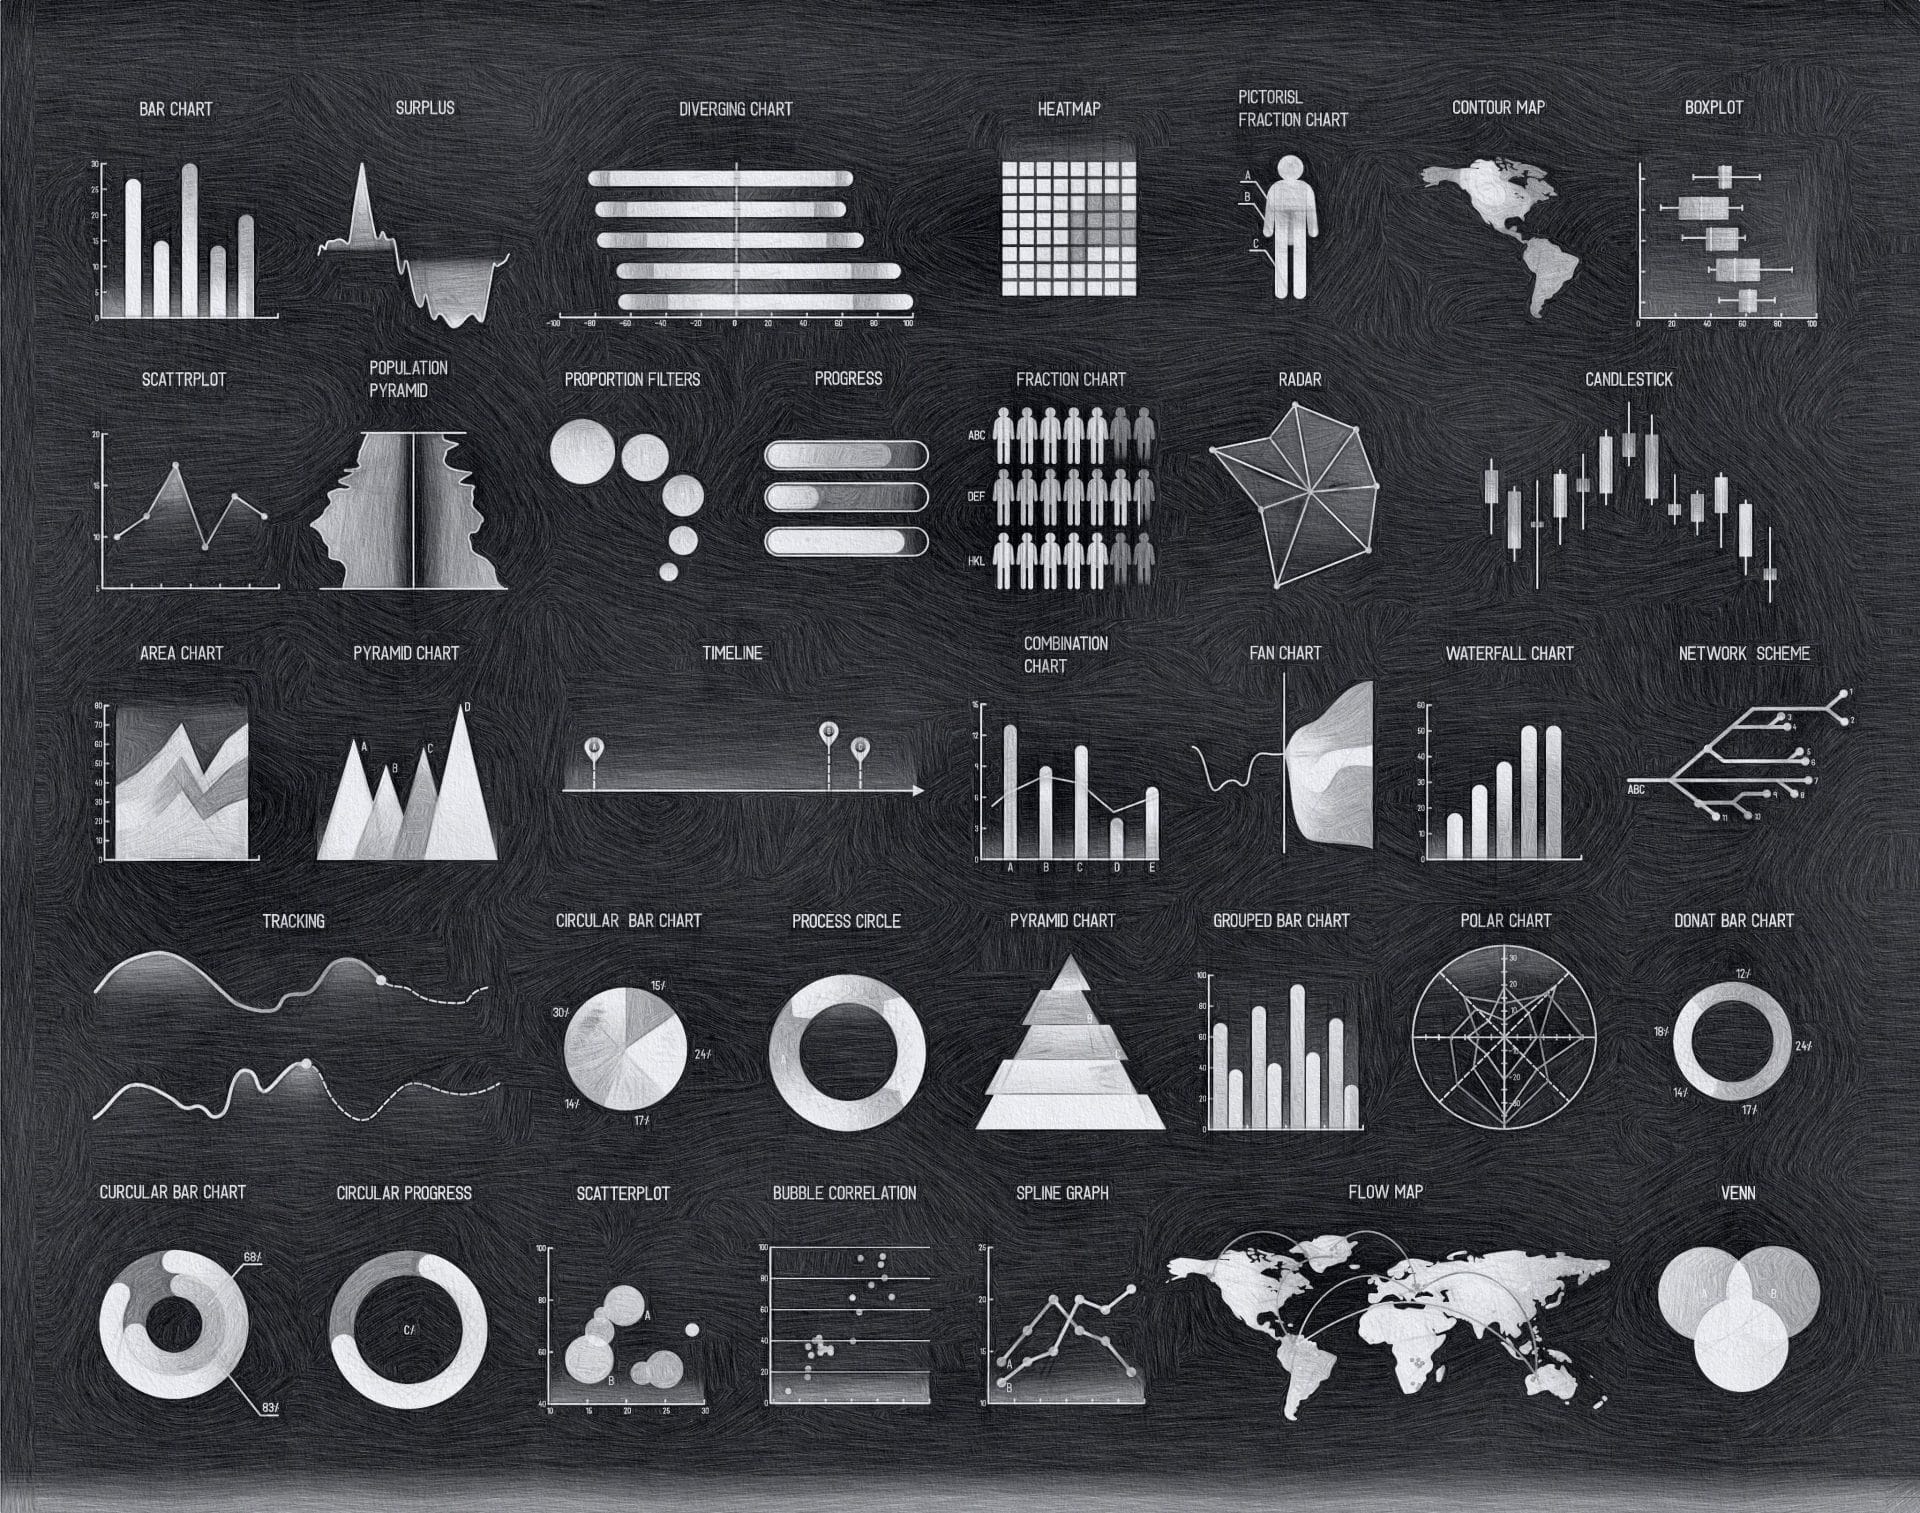
Know what Power BI charts best suit your data and insight, and what styling options they offer.
Icon for data visualization course showing a diagram onlinen

Dashboard Construction?

This guide will set you up to construct and style a dashboard to ensure a good user experience.
Data Visualization Training Icon for Report and Infographics Designers

Want Even More?

Along with the interactive style guide, you’ll get icons, PBIX files, templates and more.

Why Choose a Power BI Theme & Style Guide?

Efficiency - Save time by having all data viz styling rules easily obtainable. Effectiveness - This guide has best practice chart, styling and dashboard principles.

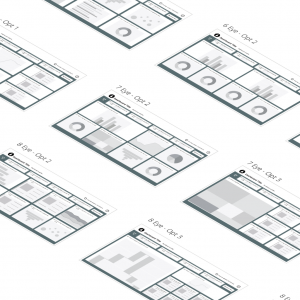
Our Power BI Theme & Style Guide is an all-in-one styling, theory, and instruction document accompanied by supporting assets. These assets include a base series of dashboard icons, template layouts, a Power BI JSON file for custom styling, and more. Use your theme and guide for a best practice data visualization. Use it for onboarding new staff or for a quick check for chart recommendations and checklists.

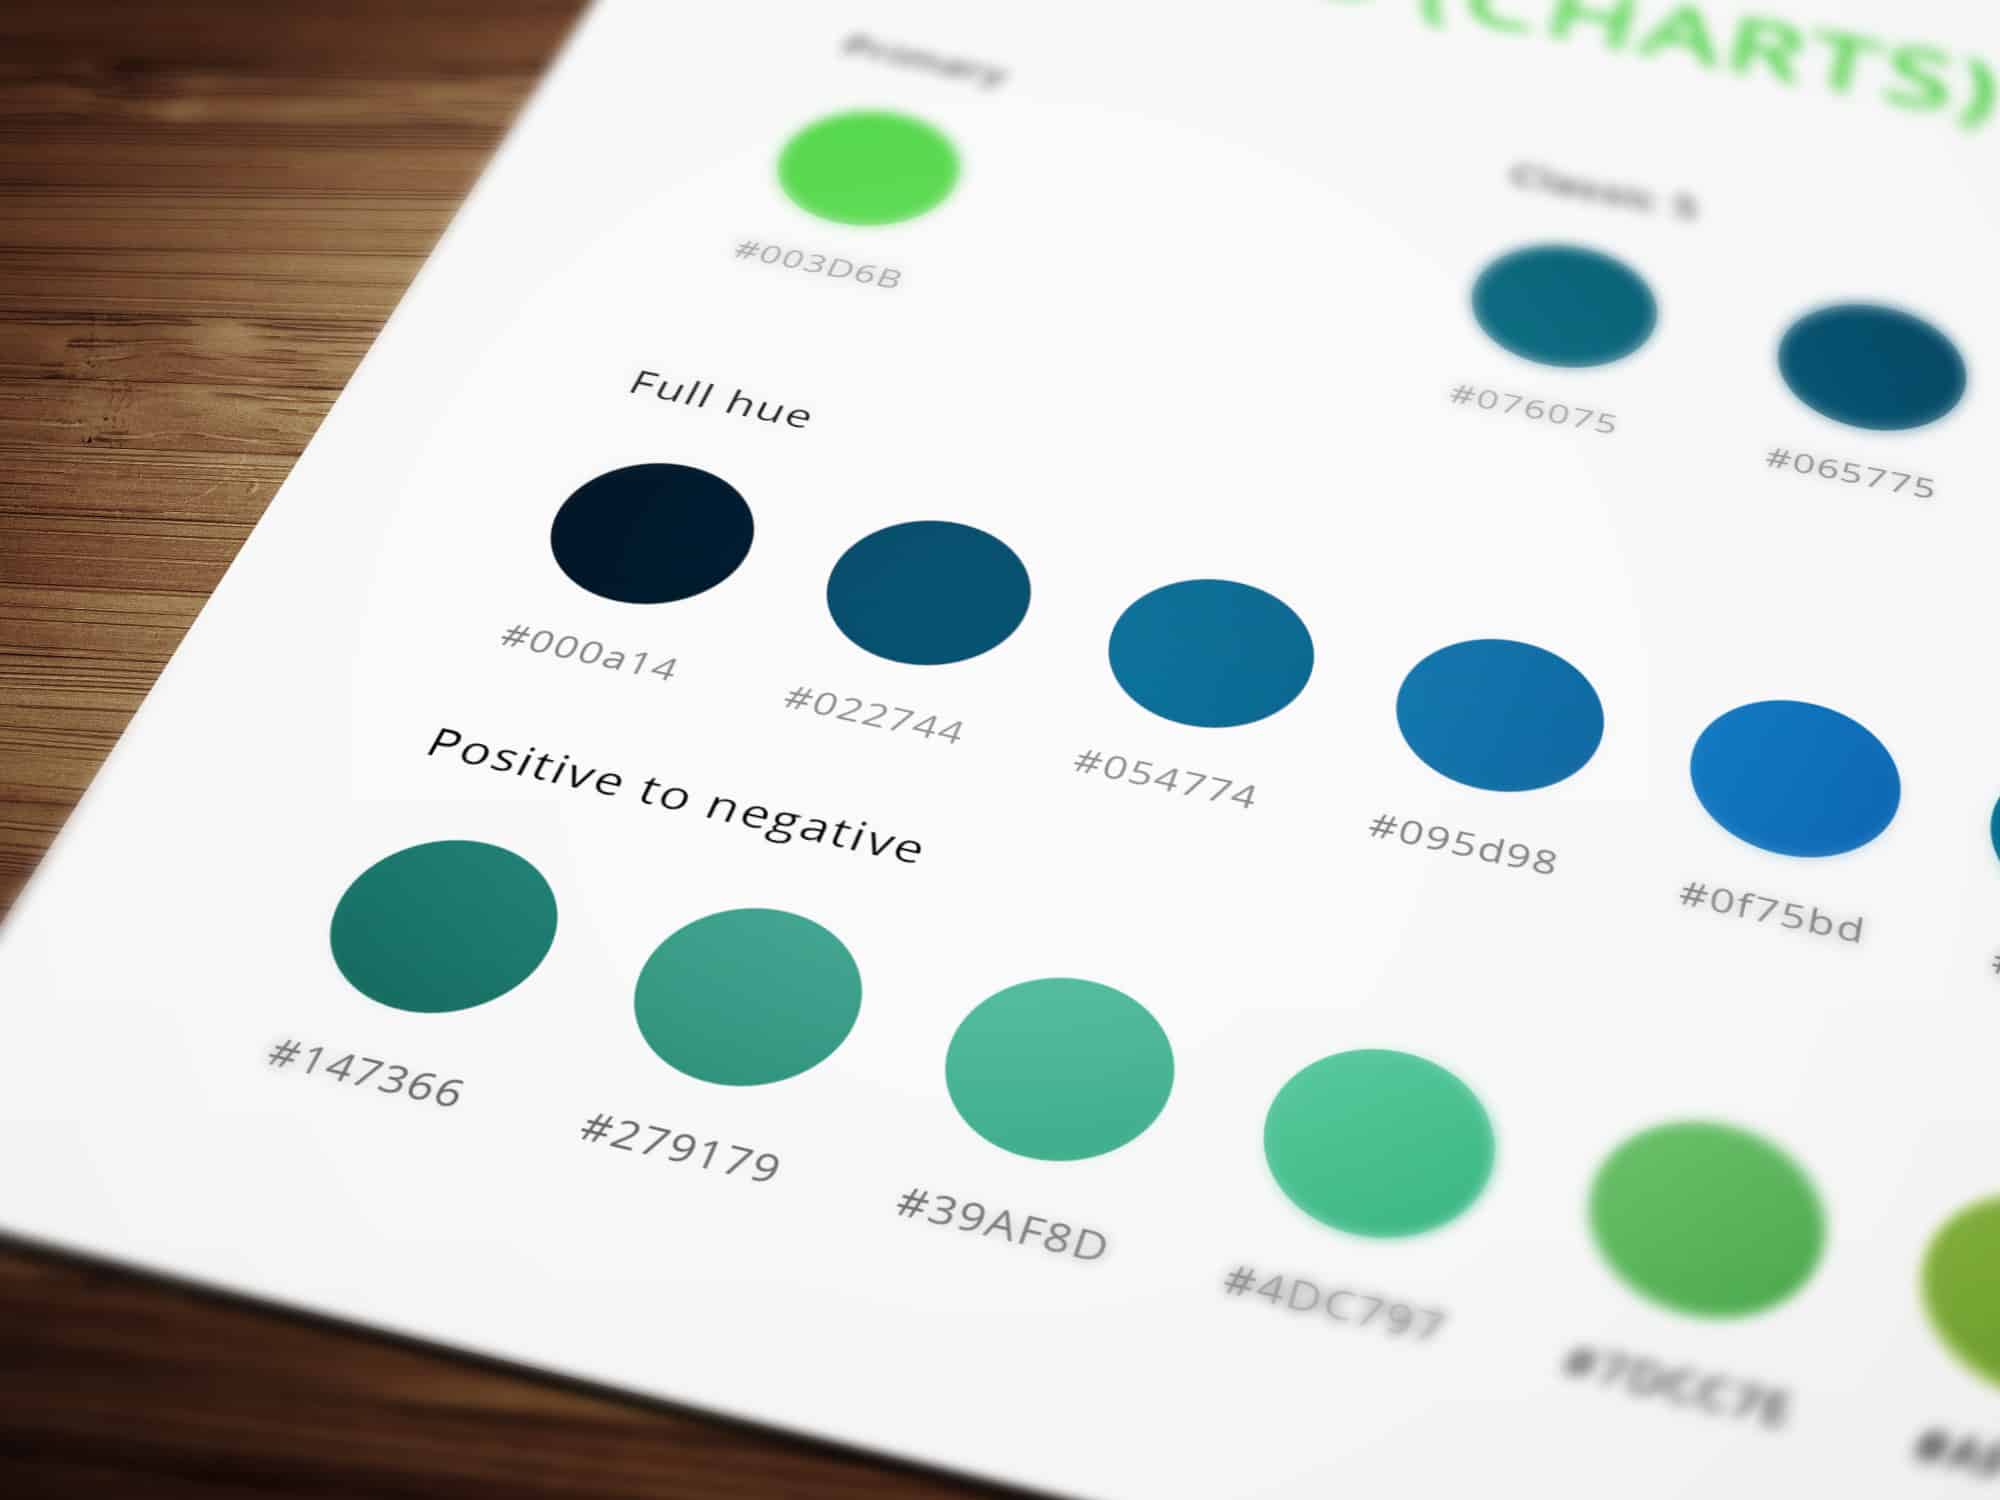
ABOVE: Opt for a business class style guide for us to load in your colors, fonts, and other elements. See this reflected across many elements including each chart displayed in the guide and PBIX file. We’ll create a .json theme file for your team to easily plug into Power BI to automate the styling components.
Data Visualisation Processes – Learn the holy grail of running a successful data viz project. We break down our tried and tested processes in a step-by-step format while providing tips, checklists and more so you can run a full data viz project with confidence.
Icon for the Generative AI Design Workshop

Theory and Instructions

Leveraging our process at Datalabs, this guide offers best practice guidance on everything from:

• Designing for your audience
• Designing for mobile
• Grid sequencing
• Accessibility standards
• Pre-launch checklists
• And much more!

Image

Styling and Charts

Styling: Quickly understand and be instructed on Power BI styling principles such as: Fonts, color palettes, icons, backgrounds and much more.

Charts: Furthermore, this guide breaks down 25+ charts by definition, design guidance and their unique Power BI visual functions.

Choose the Product Class That’s Right for Your Company

View The Datalabs Agency’s digital product and services terms and conditions and the Data Arts privacy policy.

Additional information

Product Class

Business Class, Premium Class, Standard Class

PDF pages

60 (standard class) 80 (premium and business class)

Chart types

30 (styling guidance, Power Bi capabilities, source file)

Downloadables

Layouts (25 in standard class, 40 plus in premium and business class), dashboard icon sets, json theme file (premium and business class), chart pbix file

Meeting with Datalabs

One hour (business class only)

Feedback revision rounds

Three (business class only)