


Description
What Will I Learn in This Course?
Progress quickly through the best content for visualizing and communicating data.
This course focuses on what you need to know to feel confident with designing and communicating data visually. We think this is a highly creative process that’s taught well by insiders, us. The Datalabs Agency has been training governments and corporate companies how to visualize their data creatively for over ten years.

Common Charts – Learn how to choose the right chart for your data and get to know with best practices for chart design and iterative design processes.

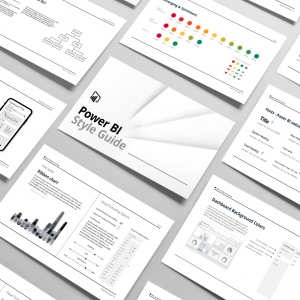
Know where data visualizers go to get inspired and sources images, icons, and more to use in their data visualization projects.

An introduction to data visualization. Learn the foundations of what data visualization is, how it came to be and how it’s used most effectively. Plus, get acquainted with the industry terms and understand the role of design thinking in data visualization. More than just modern practices, see a brief history of data visualization to know where it all began!

From Data to Storytelling to Design – Put it all together and learn how to find the stories buried in your data cells, and how to transform this into an engaging and memorable visual output. We’ve jammed this chapter with loads of practical information-design tips that you can start using immediately.

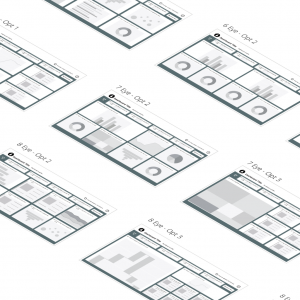
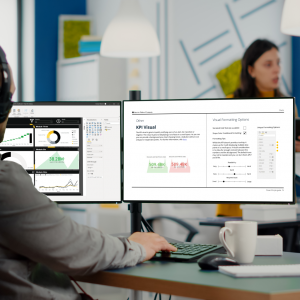
Advanced Visualizations – Learn how to tackle multi-variable data and present it clearly. We’ll touch on dashboards, infographics, web and interactive experiences and more.
ABOVE: Intro to Data Visualization Course – Learn the foundations of what data visualization is, how it came to be and how it’s used most effectively. Plus, get acquainted with the industry terms and understand the role of design thinking in data visualization.; Common Charts – Learn how to choose the right chart for your data and get to know with best practices for chart design and iterative design processes.
Data Visualisation Processes – Learn the holy grail of running a successful data viz project. We break down our tried and tested processes in a step-by-step format while providing tips, checklists and more so you can run a full data viz project with confidence.
Know What a Data Visualizer Knows
• Charts & Graphs:
See More Choices, Creatively
• History of Great Data Visualization:
• Presenting Data with a Story: Tips and tricks
• Complex charts: Cool examples and uses
• Sources: Where to get icons, templates, infographics
See More Choices, Creatively
• History of Great Data Visualization:
• Presenting Data with a Story: Tips and tricks
• Complex charts: Cool examples and uses
• Sources: Where to get icons, templates, infographics

Think Creatively Inside a Proven Process
• What questions to ask of the data? The visual answers should match the insights to communicate.
• Use a friction-less process to quickly get a first design out there in the world.
• Think in systems, think with empathy about the audience for your data presentation.
• Enjoy yourself.
• Use a friction-less process to quickly get a first design out there in the world.
• Think in systems, think with empathy about the audience for your data presentation.
• Enjoy yourself.
A Data Visualization Course for All Skill Levels
Learn to think differently about data and design.

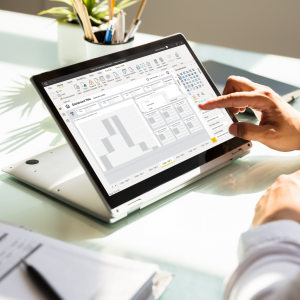
ABOVE: See data in another way — get Excel out of your vision and start drawing, start visualizing in pencil. Be a designer. We’ll show you our way of seeing and doing in this data visualization course.
Who's Your Audience?
This makes everything so much easier — have a quick think about who will use your design. We’ll teach you a method or two to possibly use.

Easy to Understand
We love design. So we gave importance to the clean and simple navigation throughout the course.

Get Your Certification!
Wise enough to take this course? Then you’ll be wise to pass it, too. Get a Certificate of Completion that you can show your employer or training manager.
Learn data visualization from professionals. Our data visualization agency has designed a process, honed for over a decade while working with clients in the United States, Europe, Asia, and Australia.

View The Datalabs Agency’s digital product and services terms and conditions and the Data Arts privacy policy.


