Description
What Will I Learn in This Course?
Learn a dashboard design process. Then take what works for you and apply it immediately in your next dashboard design.
Simple to See & Follow
Design With BI Software in Mind
Ensure your audience are satisfied with your dashboard design and narrative by choosing the right business questions and insights to present to your audience.

Dashboard interface design - Learn how to make your dashboard visually stunning through appropriate use of colors, icons, layouts and more.

Learn from designers - Once you've completed the dashboard design process, watch a designer complete a dashboard as they would for any fortune 500 company
Business Objectives - Perhaps the most important part of the process is to understand why you're designing it and what you want your audience to do with it.

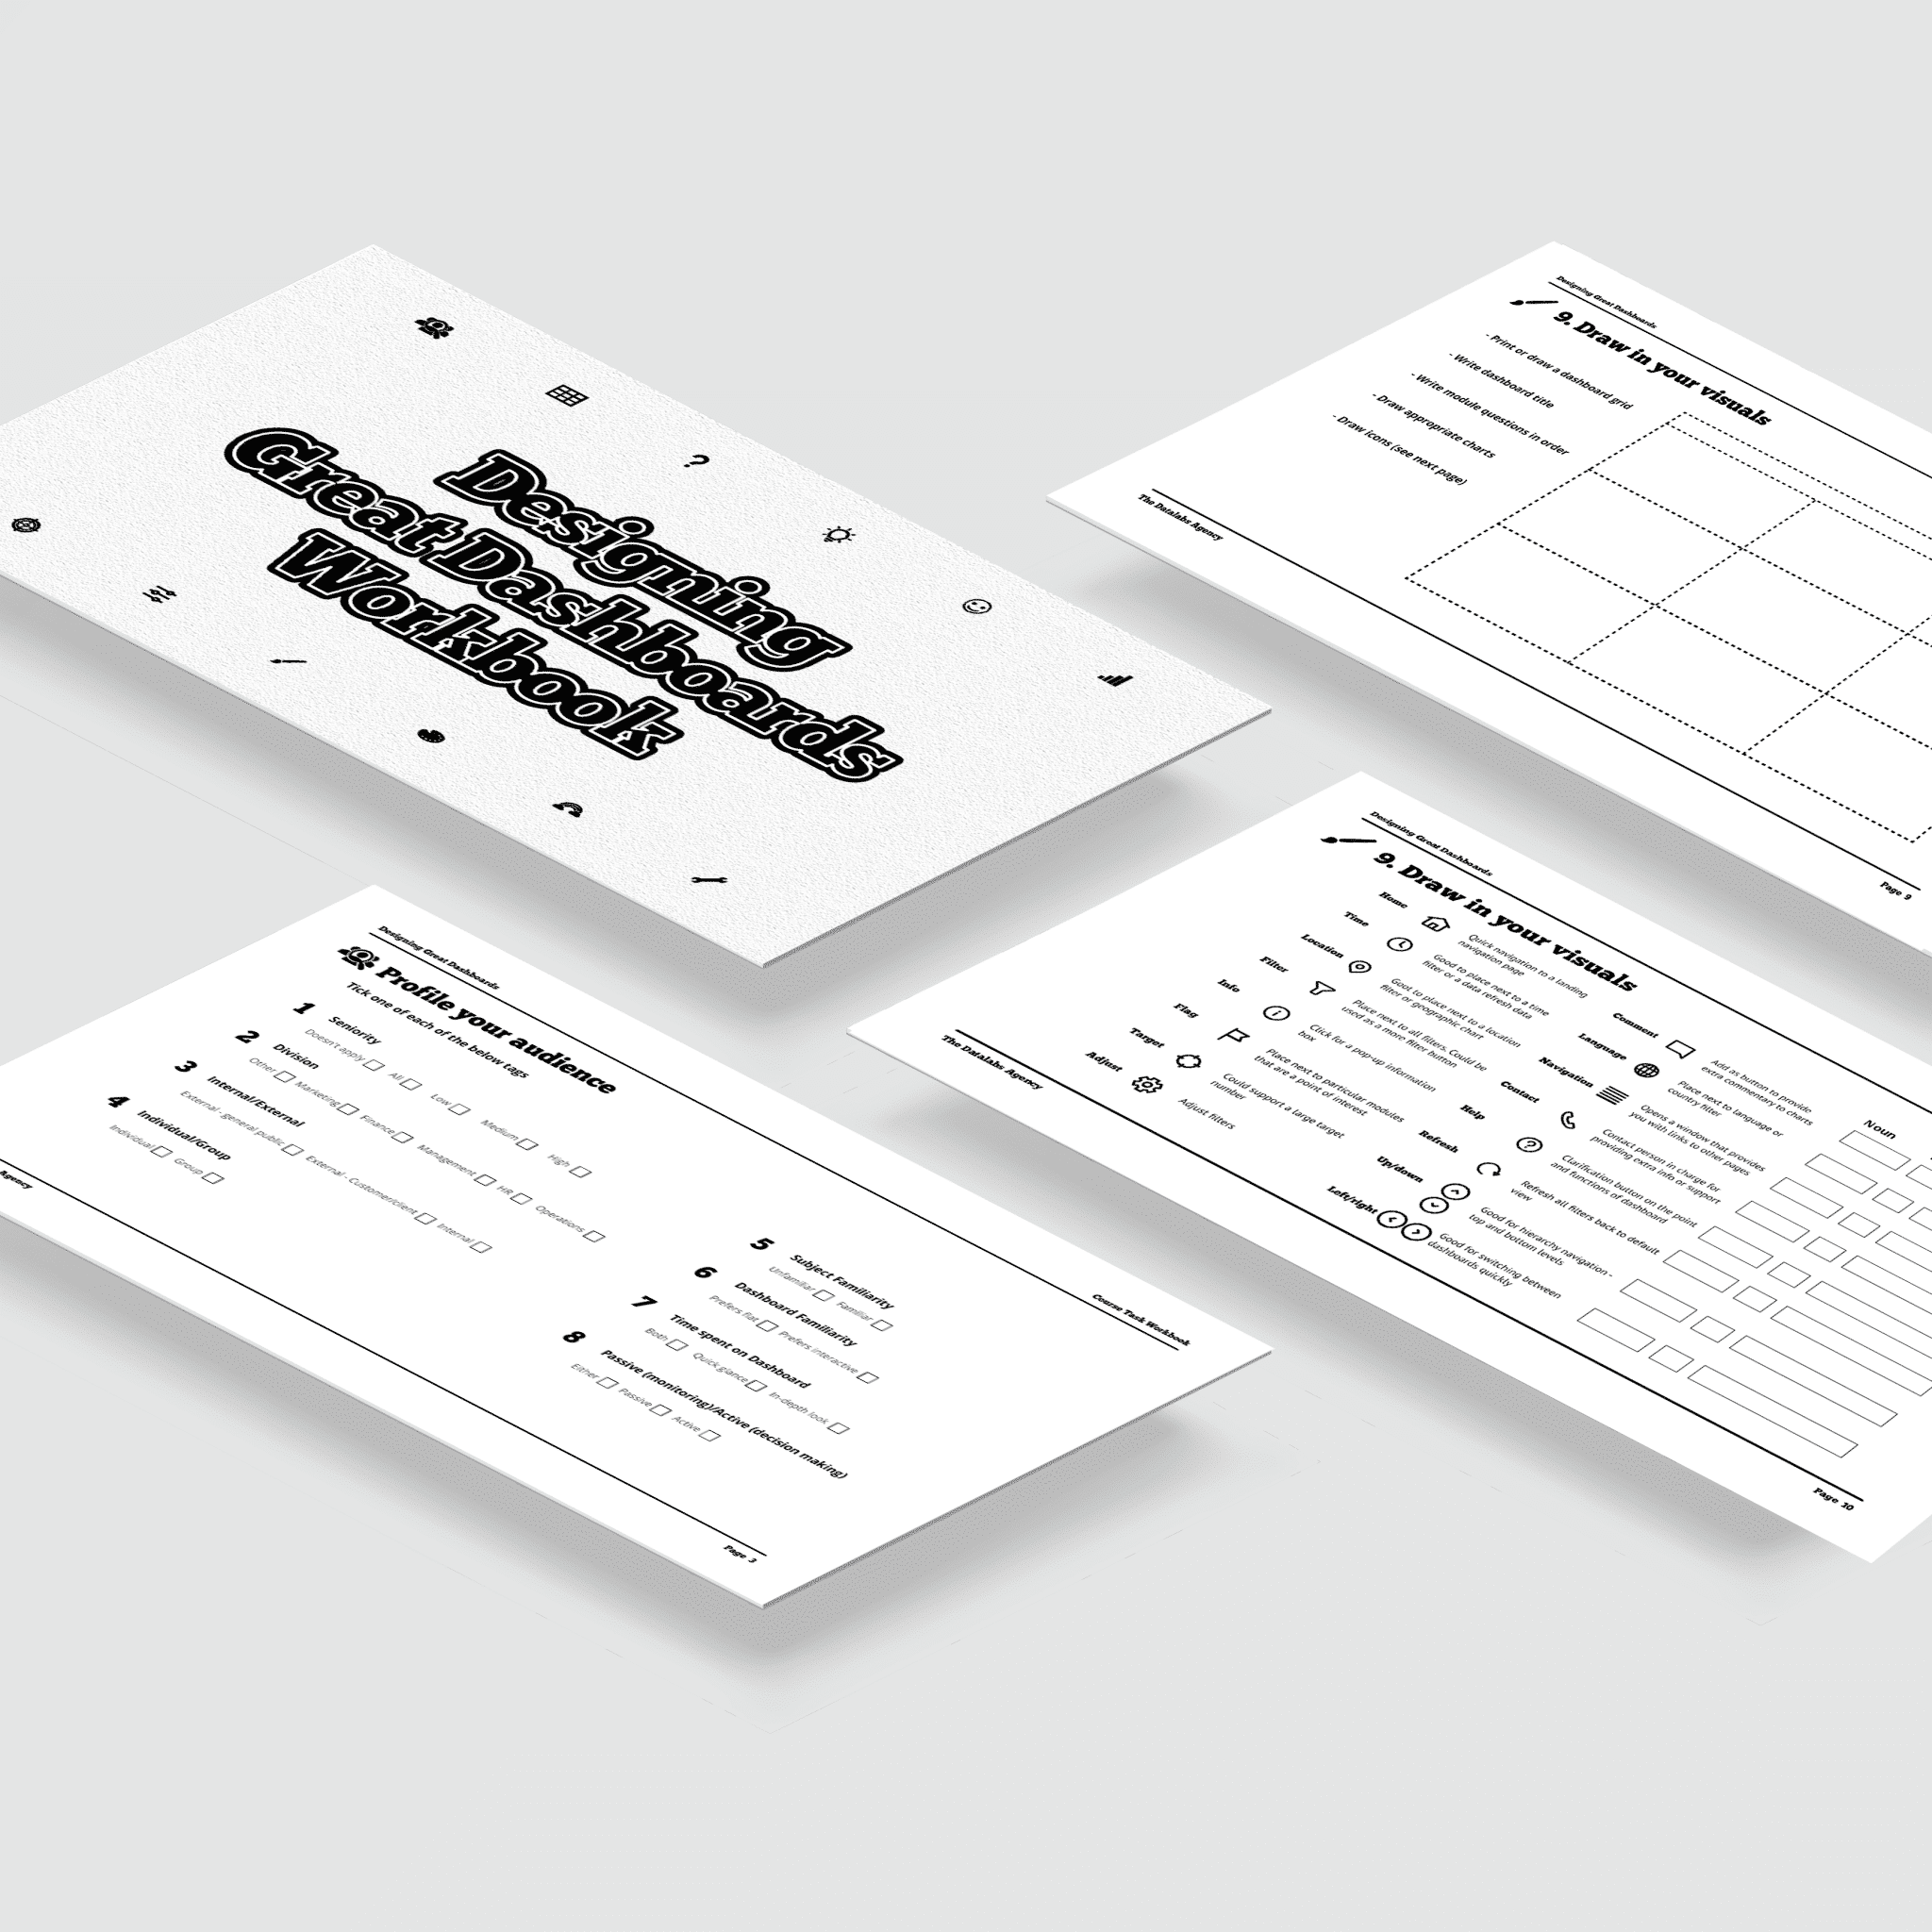
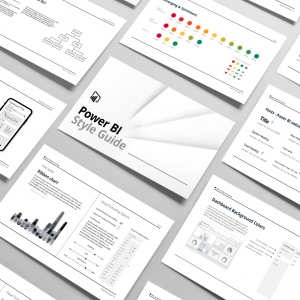
When taking this course, you'll receive a free interactive workbook to assist you in forming your dashboard brief. A crucial part of any design and development project.
a data visualizer with over 20 years of experience working in
the United States, Asia, and Australia.
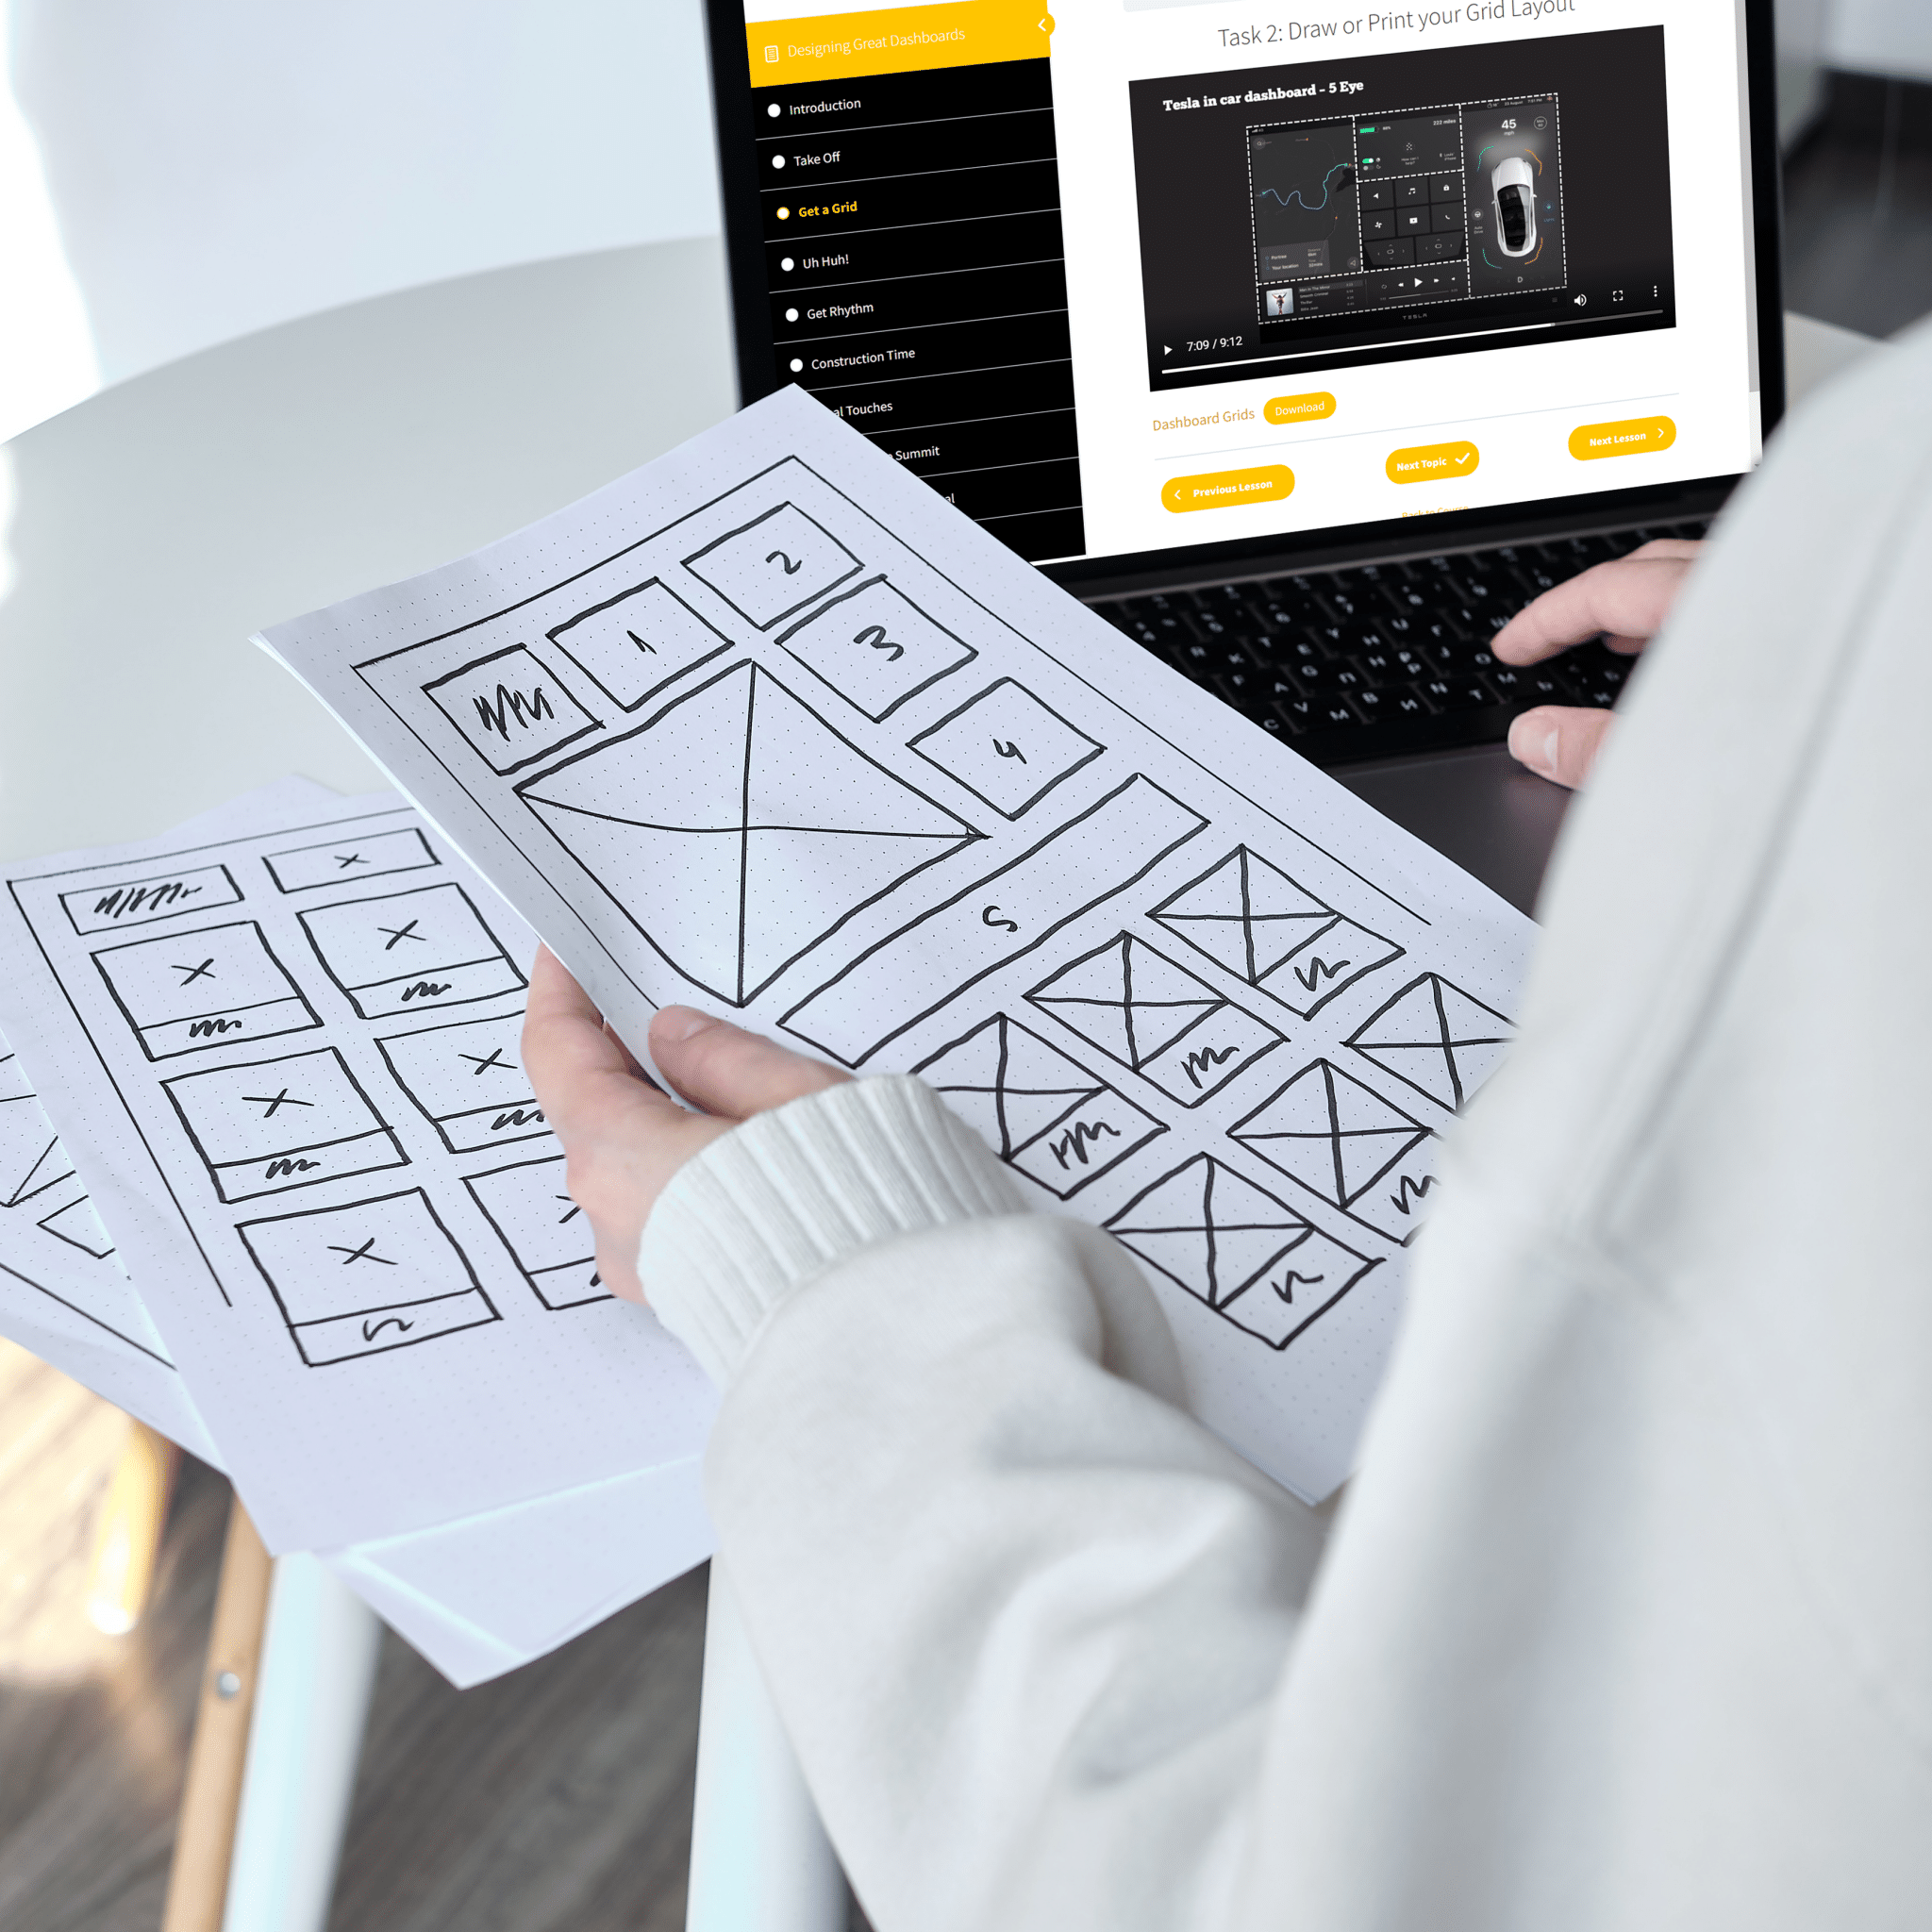
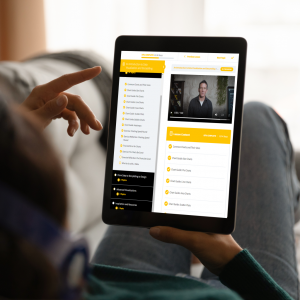
ABOVE: See inside the dashboard training course — learn more about dashboard design and what you will learn.
Be the Most Useful Human in Your Team
Storytelling With Dashboards
A Simple Practice for Design
Professional Video Tutorials
Questions & Answers About This Dashboard Training Course
- Do you want a design process used by professional data visualizers?
- Do I need to be an expert at Excel, Power BI, or Tableau?
- Are you looking for a new skill?
- What will I have when I complete this data visualization course?
- What differentiates this course from the other data visualization and dashboard courses?
- Who are the instructors for this course?
- So what do you think?
Discover the basics of designing dashboards.
Understand your audience, draw a good grid for your data, & ask questions that will lead you toward greater insights.
Learn how human emotions can be used in charts’ stories, as well as new methods for choosing what type is best suited for your data.
Then you’re free to bring your designs into software like Power BI, Excel, or Tableau. Our visual process teaches you that your designs and pre-work make great dashboards; BI software is the last step.
So if you’ve been dreaming about making your own awesome-looking dashboards, this course is perfect for you. With eye-popping visuals throughout and easy-to-understand exercises that take your dashboards from basic to impressive, it will teach you how to impress your boss and your colleagues with data visualization and storytelling.
So don’t wait another second — Add a new skill to your skillset and enroll in Designing Great Dashboards today!
Not at all. With the Datalabs Agency’s Designing Great Dashboards Course, you’ll be trained on how to take your dashboard design to the next level. But pencil and paper are all you need. Learn how to strategically set up your dashboard to ask specific questions and visualize insightful answers. Business intelligence dashboards are a widely-used and highly effective medium for visualizing data. However, the mistakes data analysts and data scientists often make are in the steps before visualizing the data in a Power BI or Tableau. Sketch out your ideas, fail fast, and revise — that’s what we believe and teach. Once you and your dashboard’s audiences are happy — then you can start to develop your designs in any software. Our data design process is software agnostic — meaning you don’t need to be a Tableau or Power BI wizard to get the full benefit of this course.
Designing dashboards is not easy. It takes years of practice and patience to master the art. But don’t worry, we’ve got your back! We’re here to teach you everything you need to know about designing professional-level dashboards in just over 2 hours with our online training course. You’ll learn how to design data visualizations, tell stories with data, choose charts and graphics that work well together, understand the end-to-end process of dashboard design – from start to finish – and much more!
Storytelling with data is now expected in many fields and industries. So skill-up in data visualization and dashboard design and then grow in confidence to present your own work. There are resources in this course to influence the next phase of your career. So don’t hold back.
At the end of our end of the Designing Great Dashboards course, you’ll have:
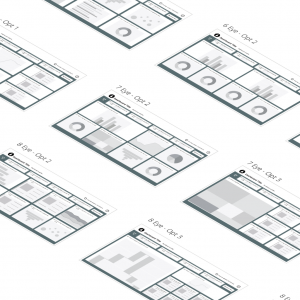
- grids, icons, and an interactive workbook to plan out your own BI dashboards, regardless of whether you use Excel, Tableau, or Power BI.
- insights and techniques on how to begin the task of planning and executing a single BI dashboard.
- an understanding of how we use data visualization, information design, and UI design to create useful and practical dashboards.
- a better understanding of how to use data visualization and business question to simplify, glean insights from data.
- the ability to prepare a dashboard project, redesign/retrofit dashboards, and understand the power of users’ feedback in the design process.
- a new set of data visualization influences and resources you can use to inspire your career move.
Most dashboard design books and courses are written by academics or those that have limited real-world experience.
Our data visualization agency has seen the same mistakes made over and over again, so we decided to create this course that cuts straight to the point. This course isn’t based on theory or academic research – it’s based on our own experience working with hundreds of companies in dozens of industries.
This is the only course you’ll need if you’re looking for an easy-to-follow process for designing dashboards from scratch. While we show the creation of a fully functioning dashboard in Microsoft Power BI, we designed it for everybody, regardless of tool and expertise. It works whether you’re new to data visualization or just want to learn a better method for designing BI dashboards.
Otto Ottinger, Managing Director, The Datalabs Agency
John “Otto” Ottinger is a data visualizer, specializing in the visual design of complex data systems. Founder of The Datalabs Agency, a strategic data design consultancy, Otto works at the intersection of user experience and user interface (UX/UI) design, visual analytics systems, and storytelling. At The Datalabs Agency, he focuses on research & development for the next generation of human-centric data design, specifically in the areas of explainable artificial intelligence (XAI), Internet of Things (IoT), and systems-level data visualization.
Kristian Wisener, Associate Director, The Datalabs Agency
Kristian is Datalabs’ lead designer and data visualizer. Kristian’s problem-solving capabilities expand the entirety of project lifecycles, all of which he teaches in training workshops. With a background in Web and User Experience design, he has developed a unique take on data visualization, bringing it into the modern-day using tools like Excel, PowerPoint, and Power BI. In training workshops, Kristian’s experience in a large variety of design outputs allows for a more tailored capability-building approach.
If you’re looking for a course that will teach you the skills to create powerful data visualizations and tell insightful stories, then the Designing Great Dashboards course is your starting point. No matter what industry or job sector, it’s always important to be able to communicate information in an impactful way, especially when we live in such competitive times.
This comprehensive online training program from the Datalabs Agency takes students through all of the fundamental steps involved with creating quality data-driven visuals: how they work; why they are so crucial nowadays; as well as where there is a massive improvement for non-designers, like data analysts, data scientists, and anyone who communicates with data but hasn’t been trained in data visualization or graphic design.
View The Datalabs Agency’s digital product and services terms and conditions and the Data Arts privacy policy.


