

Design interactive website reports...

Digital Annual Reports & Microsites

Your annual or impact report as a one-page microsite: interactive charts, animation and photography that leaders and the public can explore. Built for government agencies and corporations, from your PDF or from scratch.

From PDF to microsite...

The old annual report, rebuilt for the web

Most annual reports are still a flat, print-style document and a PDF download. We turn yours into one scrolling page that people open, use and understand.

  • Start from what you haveYour published report or last year's PDF, redesigned online with your communications team.
  • Charts that moveInteractive charts, animated video, photography and infographics held together by your text.
  • One page, clear navigationVisitors scroll one page and the menu takes them to each section.

Annual and impact reports...

For agencies and corporations

We have been designing data-driven website reports since 2011, for government bodies and global companies, remotely and on site.

  • Government annual reportsPublic reports and transparency visuals that are clear to citizens and ministers.
  • Corporate and investor reportsResults and highlights told as a story that investors and staff can explore.
  • Impact and sustainability reportsThe change you made, shown in numbers and pictures people remember.

Our work...

Microsites We Have Built
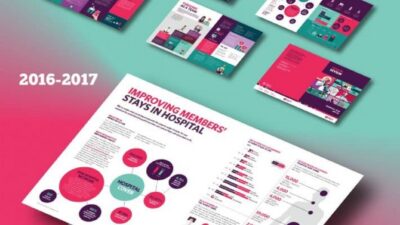
HCF Annual Report
Case study
Annual report design for HCF
An infographic annual report for a health insurer.
SEEK Employment Data
Case study
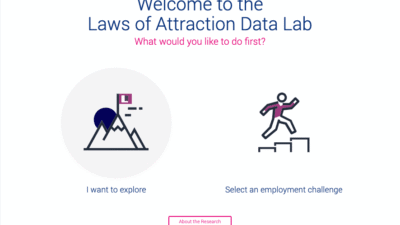
Instructions image for an employment data tool showing visualized data and practice UI designs
An interactive data microsite built on a decade of job-market data.
IWDA Annual Report 2016
Microsite
Digital annual report design from our agency
A one-page annual report for a women’s development agency.
Investa Land
Microsite
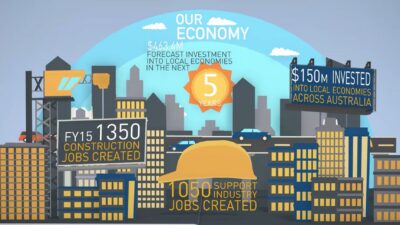
A microsite case study showing our work with Investa
Forecast investment and jobs told as an illustrated city.
APRA AMCOS 90 Years
Microsite
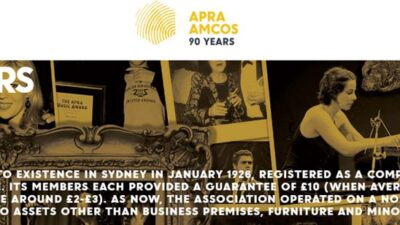
Digital annual reports example
Ninety years of music rights, told through archive photos.
ProCARE Annual Report 2016
Microsite
Digital annual reports: Our agency's microsite design for ProCARE
A clinic group’s year, with a navigation to every section.

One report, every format...

Web, print, video and dashboard

The same data and design can run as the microsite, the printed report, animated chart videos and a Power BI dashboard, so the numbers match everywhere.

  • Microsite and PDFThe web version for everyone, the PDF for filing.
  • Animated data videosShort chart videos for the report and for social.
  • Dashboards and monthly reportsKeep the story current after launch.

Global audience, global customers

WHAT OUR CLIENTS SAY

The Datalabs Agency has been designing annual reports, interactive data visualizations and business intelligence dashboards for government agencies and corporations for over a decade. Here are a few of our recent clients.


Questions & Answers

Digital annual reports
A one-page microsite with navigation, interactive charts, animation, photography and text that tell your year as a visual story. It replaces the flat, print-style report and the PDF download. See how an interactive annual report works.

Yes. The Datalabs Agency can start from a report you have just published, or from a PDF or printed report from the past, and redesign it online with your communications team.

Yes. We build public reports and dashboards for government bodies and annual and investor reports for corporations. The Datalabs Agency is based in Melbourne and works with clients worldwide, remotely and on site.

Every project is scoped and quoted as a fixed price before you commit. Contact us with your reporting date and the report you have now, and we will tell you what is possible in your timeframe.

We run a design process built around people: designers with more than ten years of dashboard experience, and project managers who run every engagement. We use AI inside that process, for analysis, visualization and storytelling, to move faster. What the data says, and how it looks, stays with our team. We also teach your team to use AI in their own analysis, dashboard design and presentations. See our AI Consulting page.

Interactive annual reports explained...

Interactive Reports »

Box with a chart on it, visualizing the data analyst's toolkit's designs and templates product
Box with a diagram on it, visualizing the data analyst's toolkit product

Plan your microsite...

« Microsite Design

Tell us about your report...

Digital Annual Reports & Microsites

Tell us your reporting date and the report you have now. We reply with what is possible in your timeframe, usually after a short conversation.
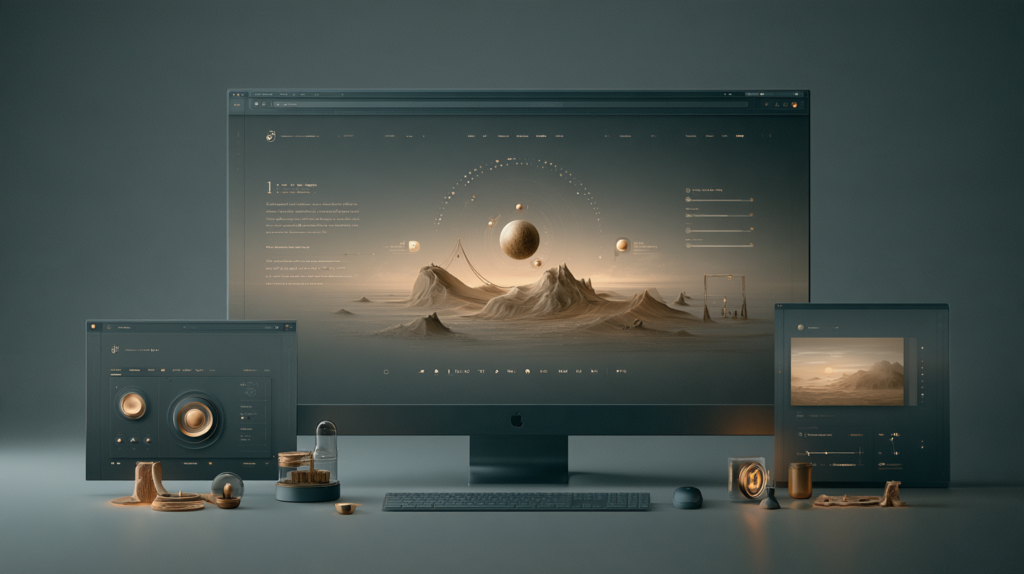
Designing for microsites for client image

Ready to start?

Get in Touch!