


Our UI style guides explain, demonstrate and help your analysts and developers get the most out of interactive and data-driven web applications — without sacrificing the visual appeal. We see organisations invest in data visualization technology but forget the crucial aspects of visual communication — the design, the style, and user experience. As part of our style guide we’ll develop your visual reporting language and style, so everyone viewing your reports understands your information quickly and with an overall visual style that is repeatable through the whole organisation.
UI Style Guides
What’s Included in Our UI Style Guides?
Designing with Highcharts & D3
Charts & Graphs
Templates
Styling
Instructions
Extra
Quotes About Our UI Style Guides?
“Everyone is very pleased with the template that was produced by the Datalabs Agency, and I found them very pleasant to work with and open to our ideas. We have now produced a number of final study reports using the templates and they look great.”
Style Guide Feedback
Victorian Institute of Forensic Mental Health
“Thanks for the design overview and the development assets. The style guide is very detailed and informative.”
Style Guide Feedback
Daimler - Mercedes Benz
Pair Your Style Guide with Training!

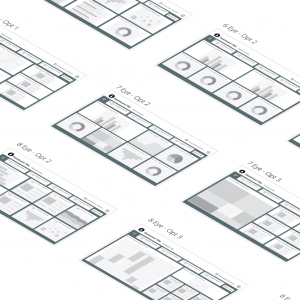

Get the best grids, layouts, navigation, and UI components for your dashboards.
Price range: $1,124.00 through $1,978.00
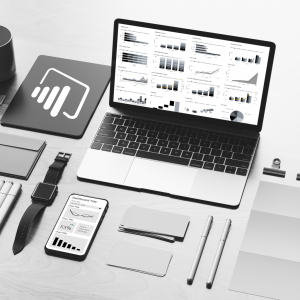
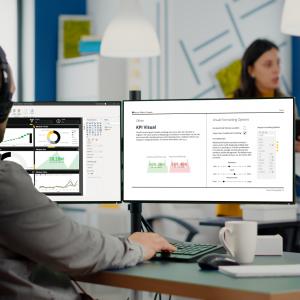
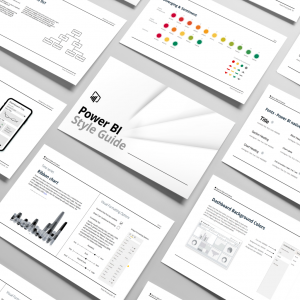
An all-in-one package containing tools, guidance, and assets to design great dashboards
Price range: $427.00 through $1,067.00
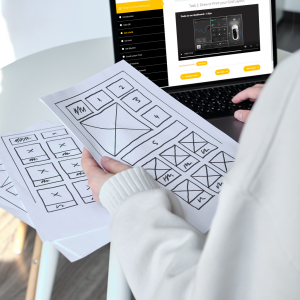
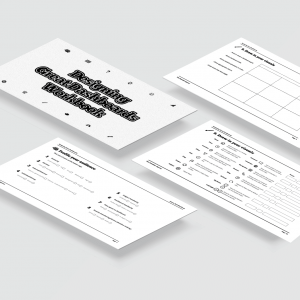



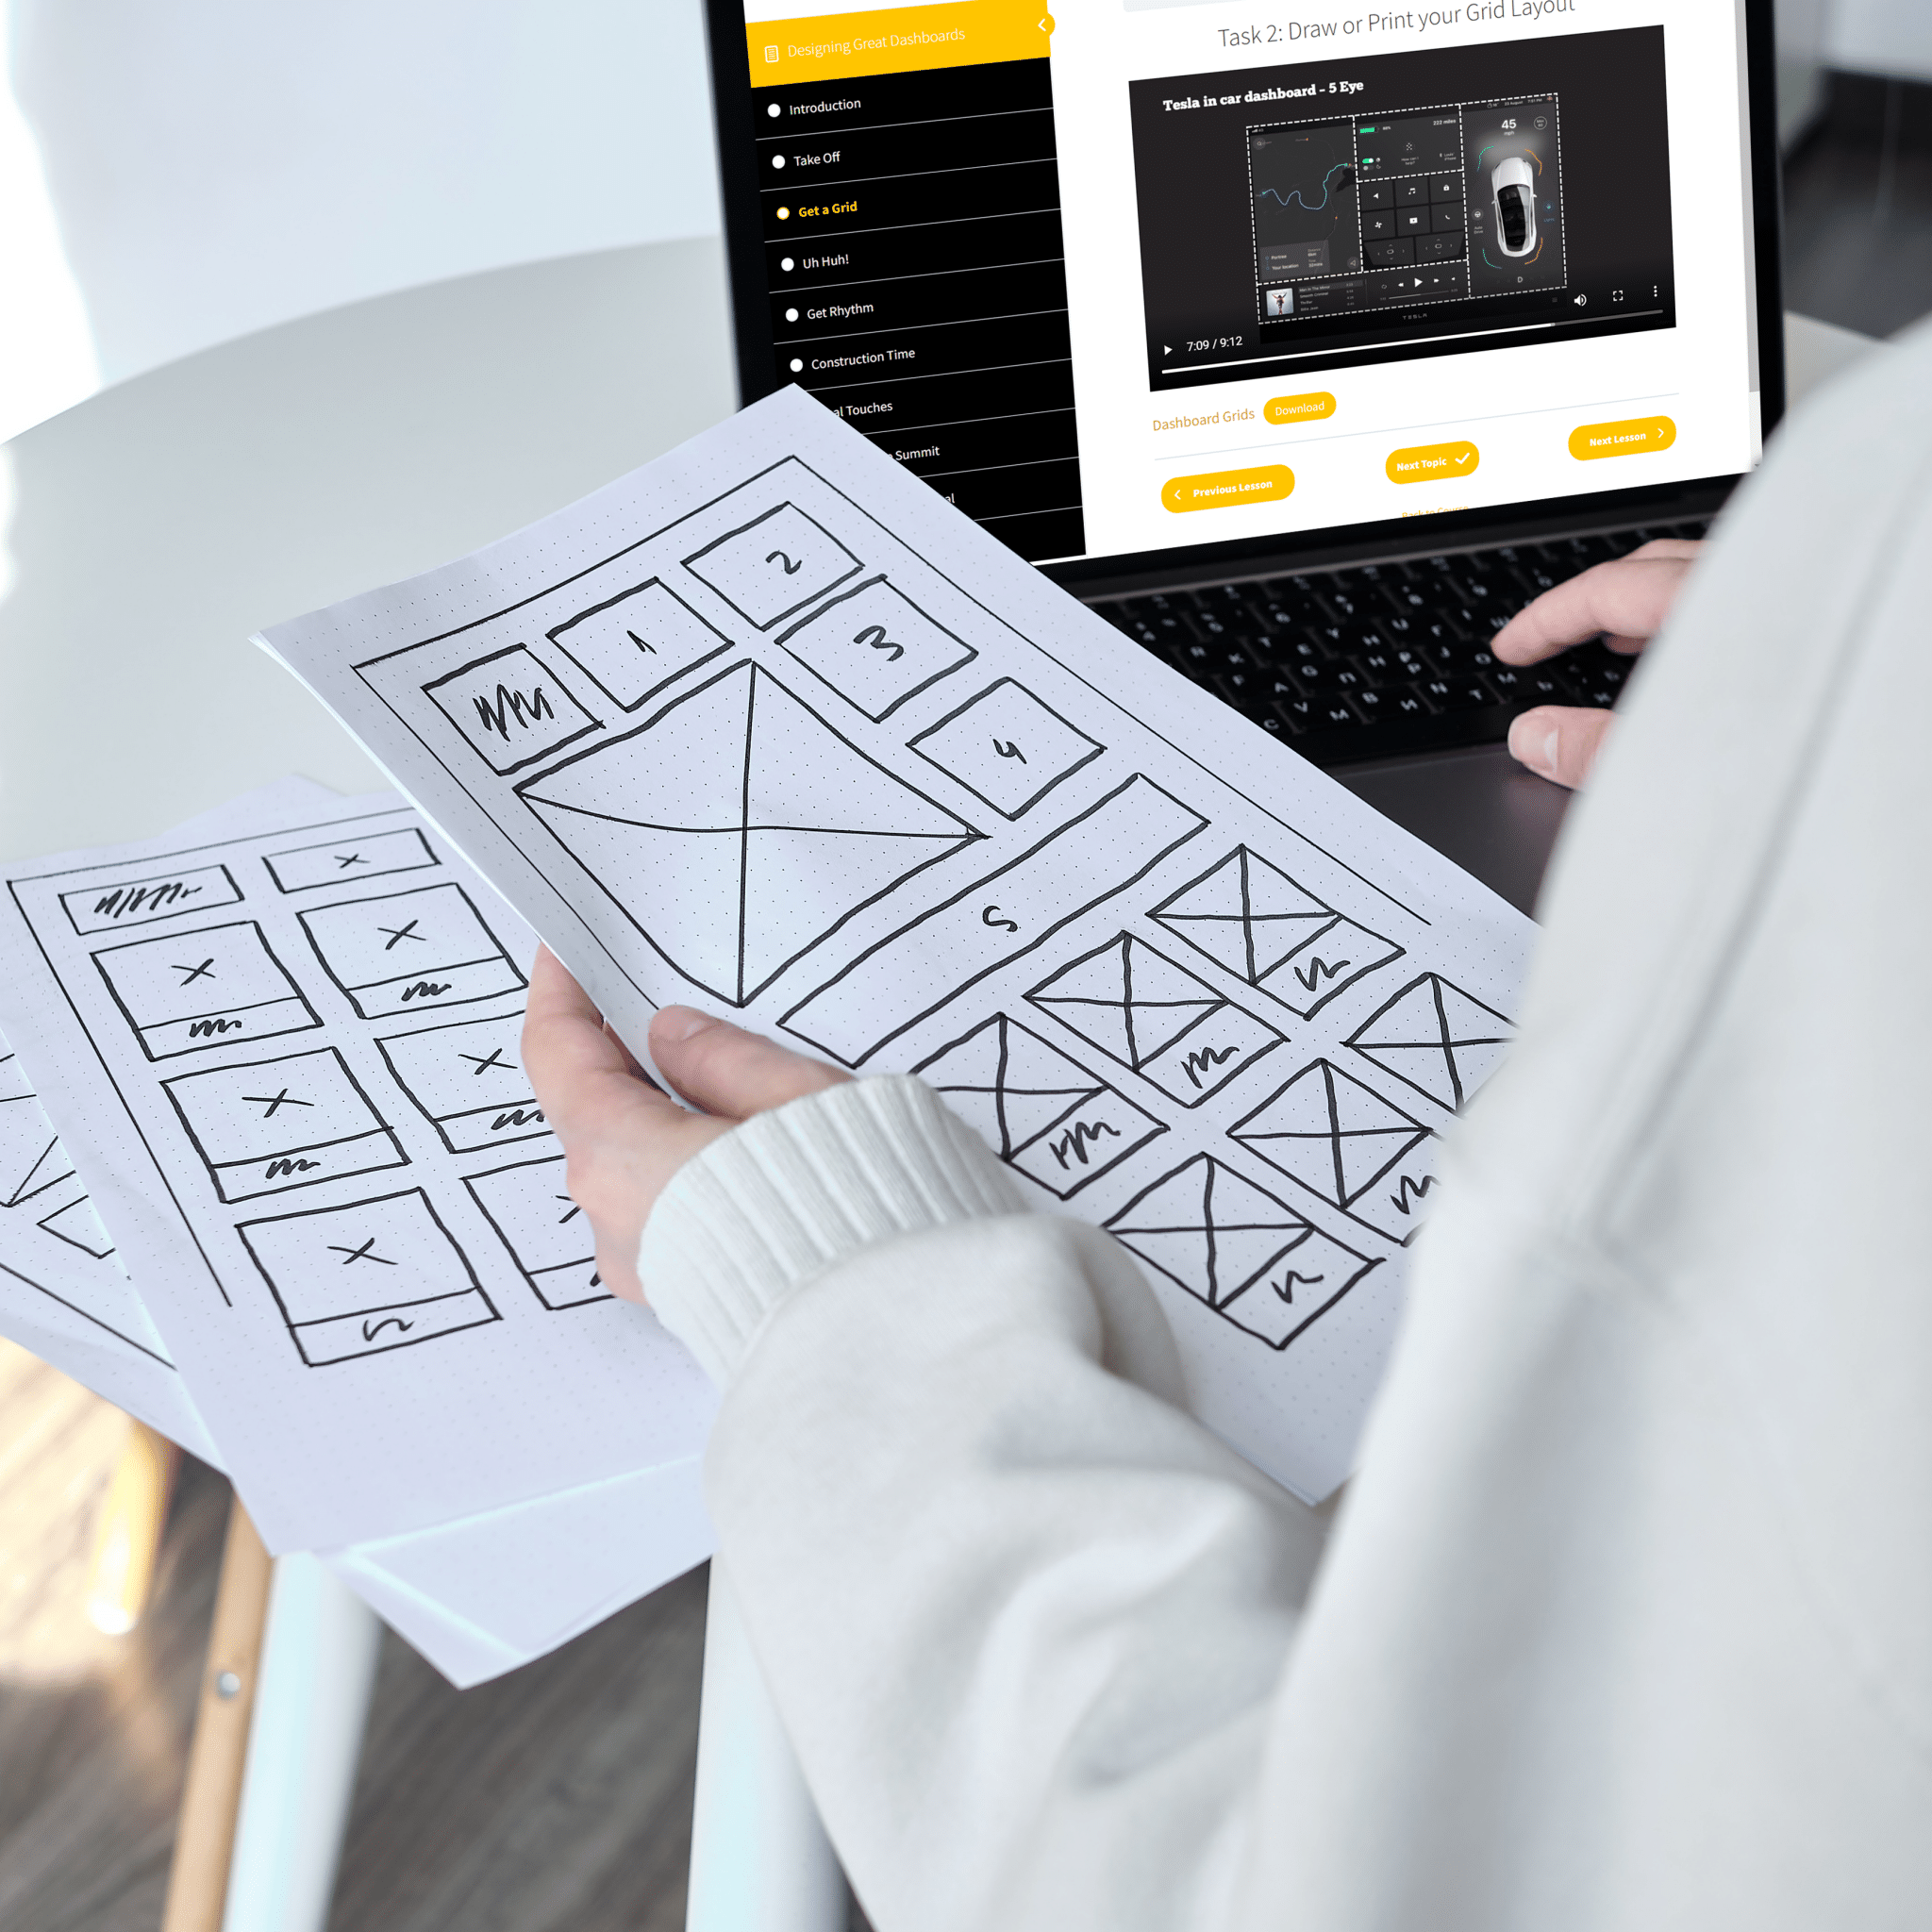
Finally, a course that shows you what you need to know.
Original price was: $184.00.$127.00Current price is: $127.00.
Two Classes for UI Style Guides
Standard Class
Business Class
Our Simple Process for Designing UI Style Guides
Other Offerings That Go Well With UI Style Guides
Data Visualization Workshop
Datalabs Agency delivers data visualization training workshops — Power BI, Tableau, and data storytelling — on-site across Australia and internationally, or live over Microsoft Teams and Zoom. Since 2012 we have trained teams at more than 80 organisations, from government departments to companies like Mercedes-Benz and Adidas. A workshop pairs naturally with a style guide: your team learns the principles behind every rule the guide sets down.

Data Viz Online Learning
Prefer self-paced study? An Introduction to Data Visualization and Storytelling is our online course covering the same process we use in client work: finding the story in your data, choosing the right chart type, and designing reports people actually read. Work through it at your own pace, then keep your style guide beside you as the day-to-day reference.

Design Services
You can also have us produce the first design under your new style guide — a dashboard, report, or infographic that shows your brand at its best and gives your team a worked example to follow. Many clients start here: one professionally designed piece makes every rule in the guide concrete.