Analysts aren’t designers. And data science is different than data design.
We should know. Datalabs employs both the left and right brainers. We know it’s a rare individual that has both the skills to extract insights from complex data sets and then can turn heads with a beautiful visual story.
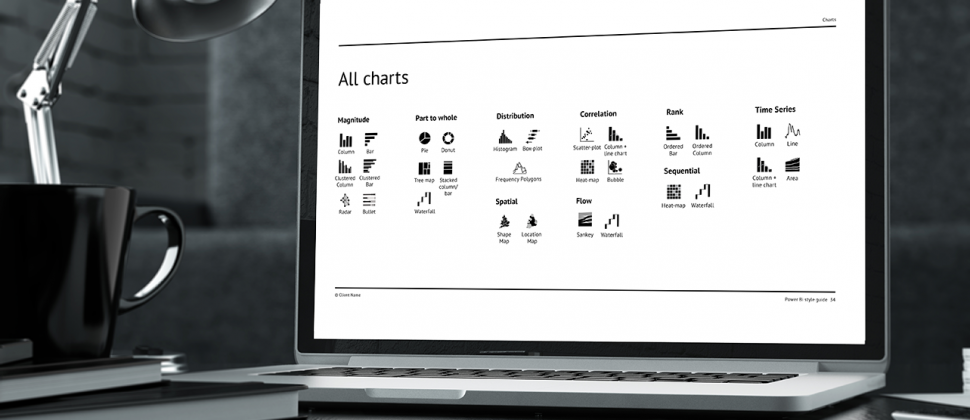
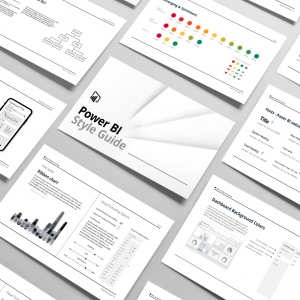
So give your data team a data visualization style guide, a visual blueprint that bridges the gap between art and science, between left and right brain thinking.
We create data visualization style guides using best practice techniques from our own data visualization work, giving you a style guide that defines the best possible use of data visualization in your reporting & analytics.


