


In late 2019, the Datalabs Agency was approached by the South East Asian division of Daimler, (Mercedes-Benz), to assist in visualizing a series of sales dashboards using Power BI along with commissioning a Power BI data viz style guide tailored to their brand. The Datalabs team packed their bags and set off for tropical Singapore to meet up with the Daimler team. We were instantly enthralled upon arrival at the renowned Changi Airport (which can be seen in the background of the above video), setting the scene for what was to come…
Upon meeting the Daimler team who were a mixture of folks either local or flown in from the HQ in Stuttgart, Germany, we set to work on understanding and sinking our teeth into the current issues, requirements and ideal objectives they had with their sales data and designs. This full-day session was constructive to all. The passionate onsite collaboration and whiteboarding generated new ideas and solutions, most of which carried through to the end product. It also sparked a need for even more dashboards, bringing the grand total to 12! This suite of dashboards proved ideal as it works more as a strategic system where each dashboard communicates to one another from the highest executive snapshot level down to the dirty data deep dives. This system would break silos.
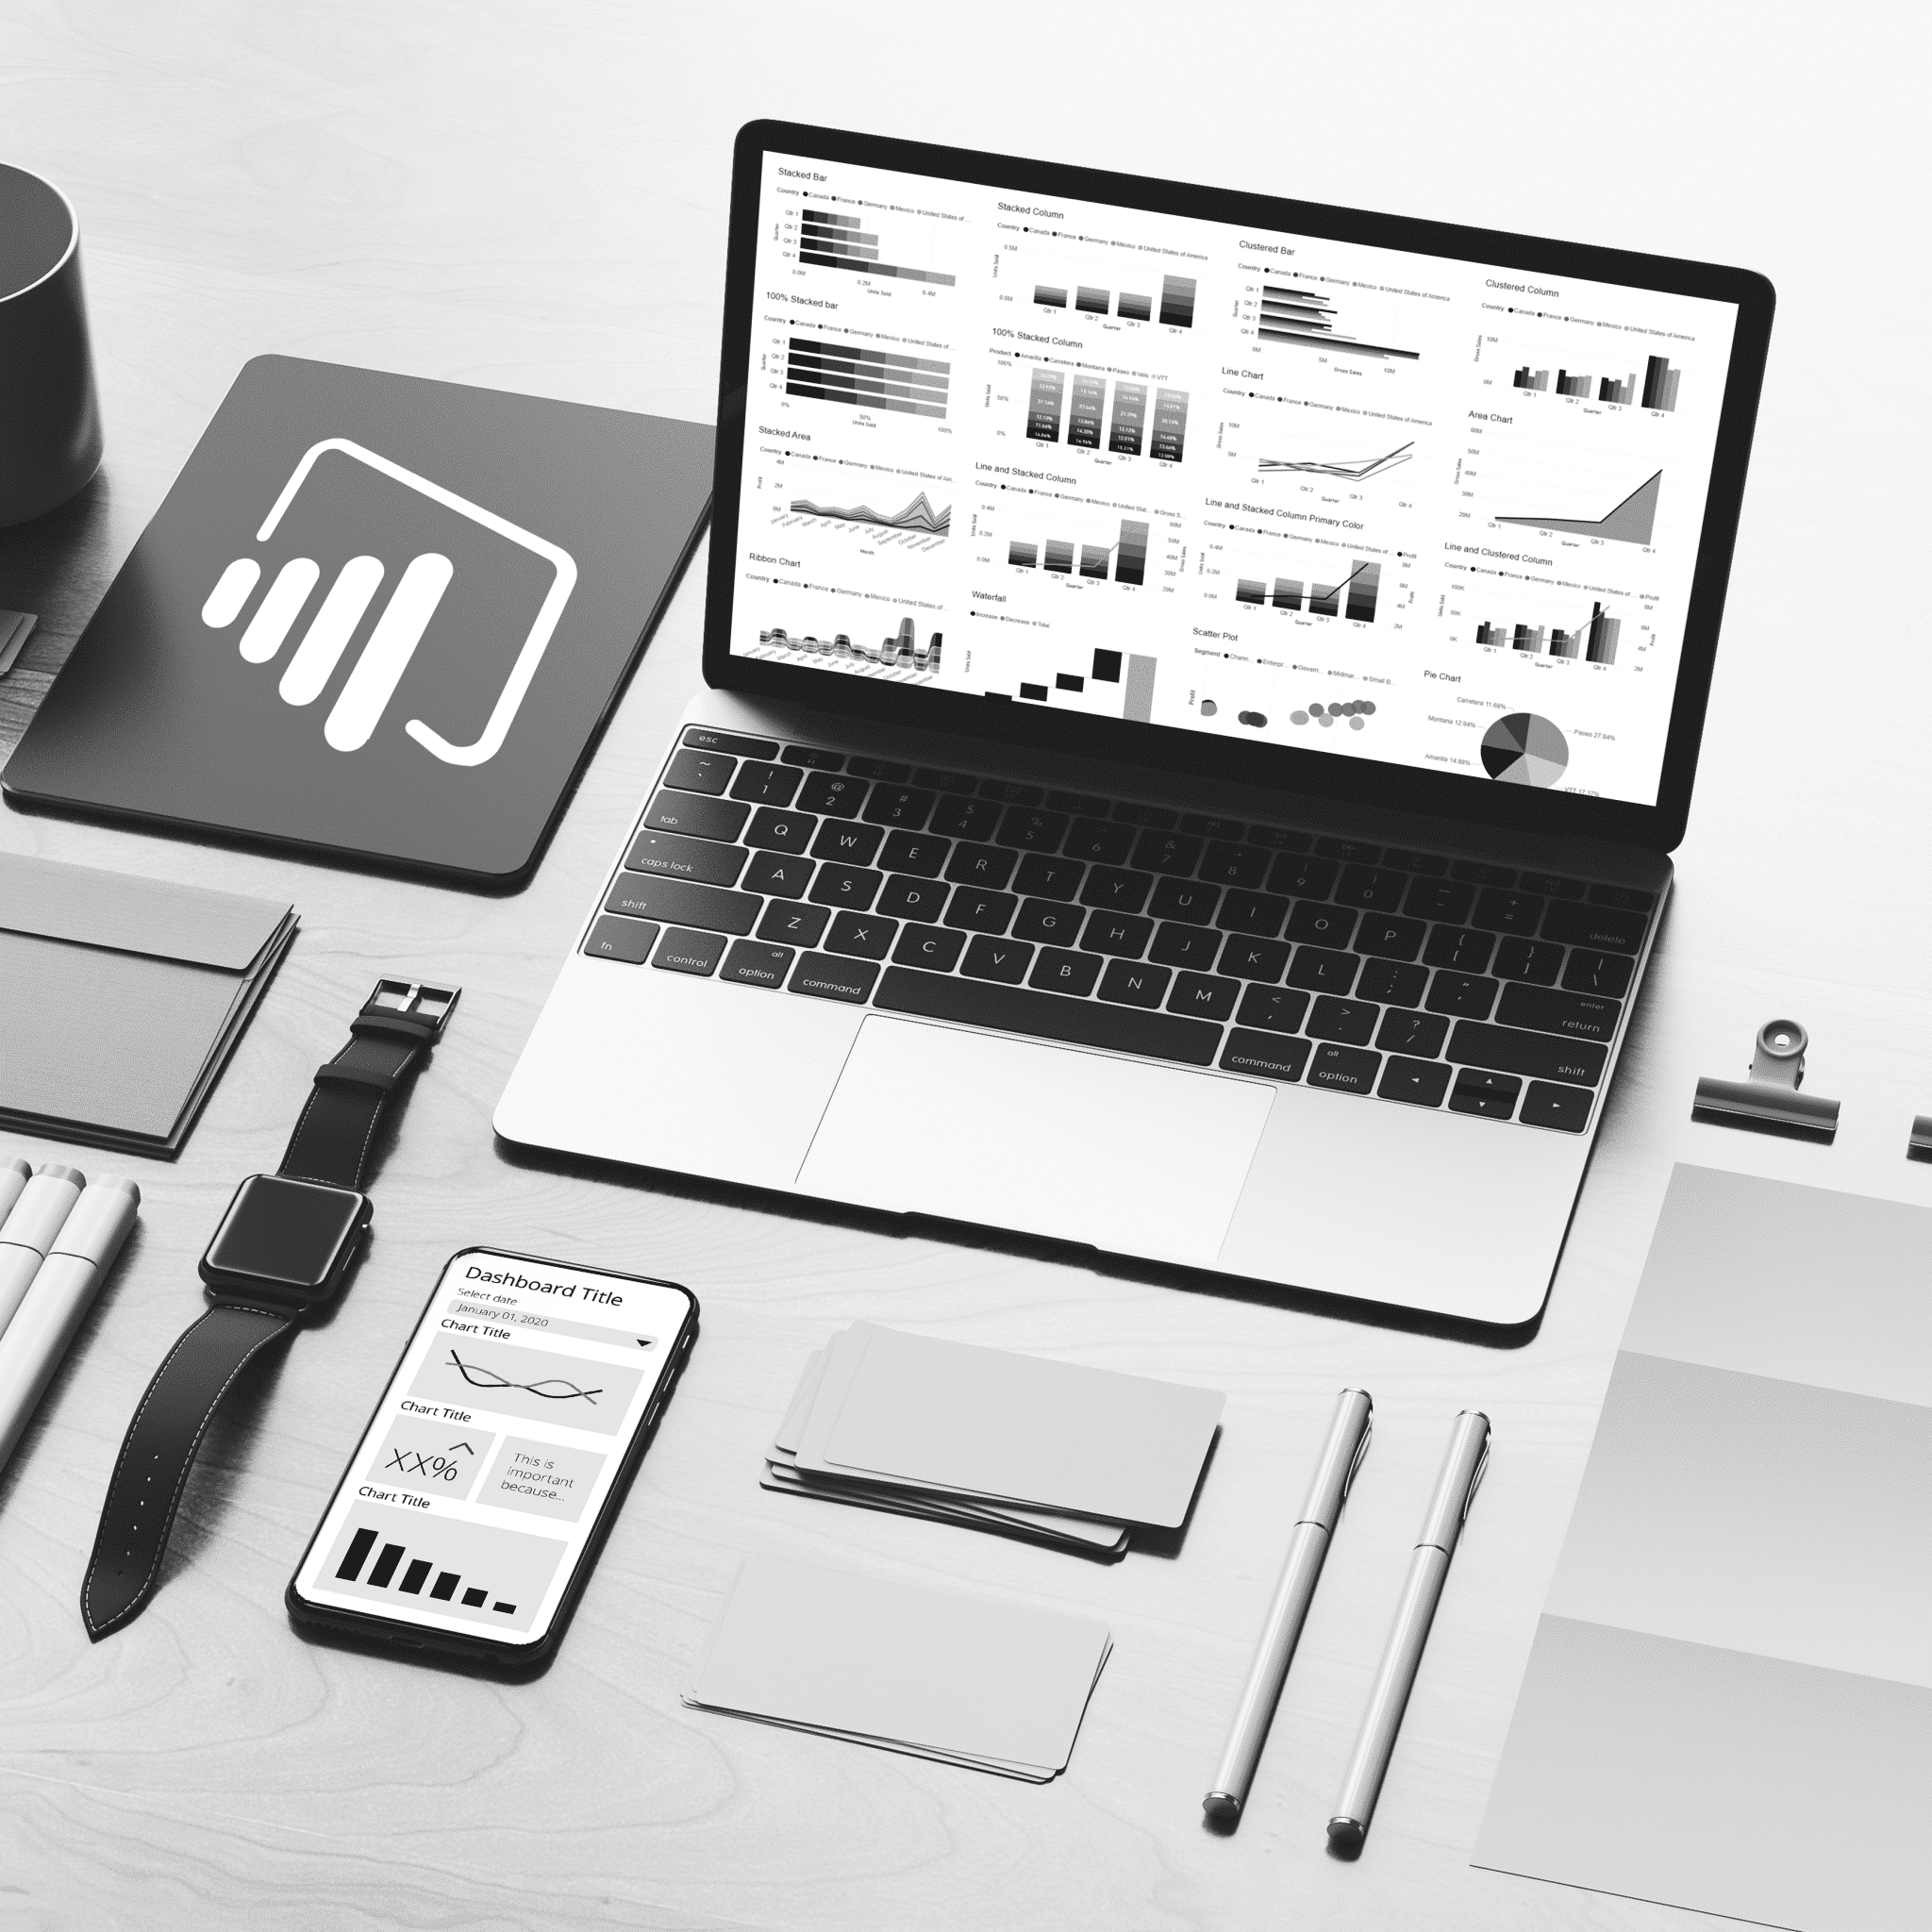
Upon returning to home-base, the Datalabs team began their process of converting ideas into tangible outcomes; and it all starts at our trusty whiteboard. From here, decisions are made as a team and our squiggly sketches evolve into building the design prototypes, complete with exportable Power BI assets. (Our lead designer, Kristian, had also changed his computer wallpaper to a Mercedes AMG car by this point also! Gotta keep that inspiration flowing.) Throughout the process, the team kept up communication with both Stuttgart and Singapore\ as they moved through each design phase. Along with the Power BI dashboard designs, the Mercedes-Benz style guide was moving along in parallel as we compiled and finalized Power BI-specific color palettes, icon sets, UI elements and layouts. With the prototype options now ready in our hot little hands, the Datalabs team set off once more for Singapore to present! And, boy, did stakeholder excitement grow. Never missing a good opportunity to check out the latest in art-meets-tech, the team used the last few hours before their flight to hit up some gallery and museum spaces, like Singapore’s ArtScience Museum (which we highly recommend for any modern tech, or, art enthusiast – wow, Singapore).
With the last notes and feedback gathered from our final trip to Daimler in Singapore, the Datalabs team was ready to roll out the final steps of the process: finessing the designs to perfection. The dashboard designs were then shipped, along with the finalized style guide for Daimler developers to reference now, and in their future Power BI projects. The developers were clearly happy with the new resource, commenting, “The Power BI style guide is very detailed and informative.” (Something we know not many BI developers get in a brief!)
We’re very happy to say that each stage of this engagement was a mutual success, with Daimler coming out of it with long-term solutions and valuable internal resources, and with Datalabs learning a lot more about the Sales and Automotive sectors and how we can push those data visualizations further.interactive technology. For that, expect a case study in the not too distant future.


