



10 Data Viz Guys & Gals to Follow on Instagram
Want constant #inspo on your #insta? Follow these awesome data visualizers to keep you motivated.
1. Mona Chalabi
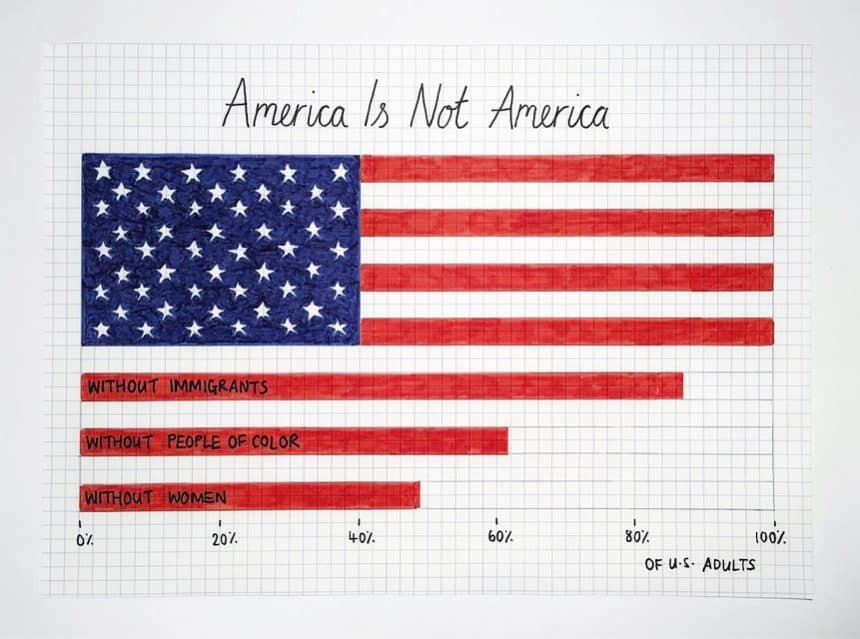
Mona Chalabi is a data editor at The Guardian US and with almost 25,000 Instagram followers, she’s basically the queen of #dataviz on Insta. Mona’s simple but unique style of hand-drawn charts and graphs nicely balances the often-confronting statistics shown in her work. A must-follow.
2. Giorgia Lupi
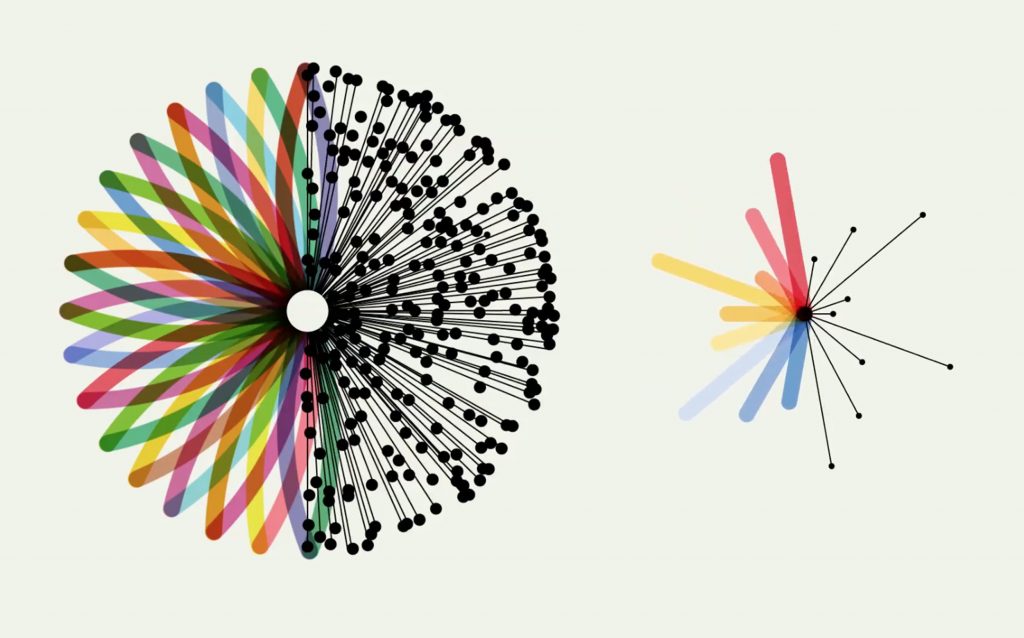
Giorgia Lupi describes herself as an information designer and is the design director at Accurat. Her Instagram is a nicely curated profile that offers a sneak peek into her data design world.
3. Laurie Frick
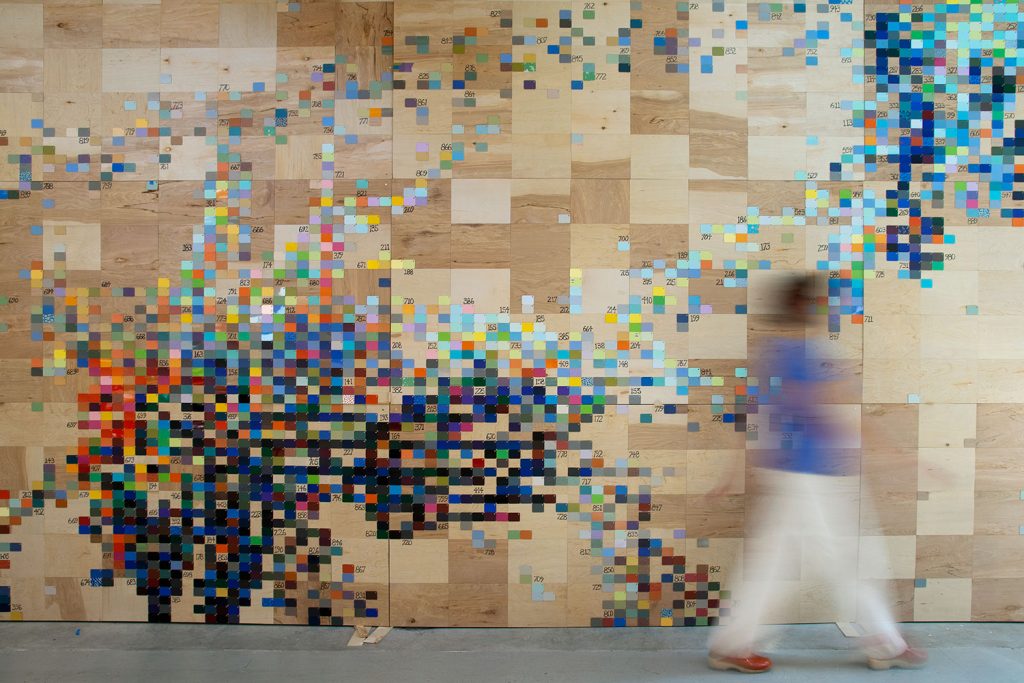
Laurie Frick is a renowned data artist, but with only a modest following on Insta, she’s still one to watch. Like Lupi, Frick offers an insight into her data-visualizing world. Her ‘gram profiles a lot of her work, and we reckon it’s the perfect Insta to follow for instant inspiration!
4. Dear Data
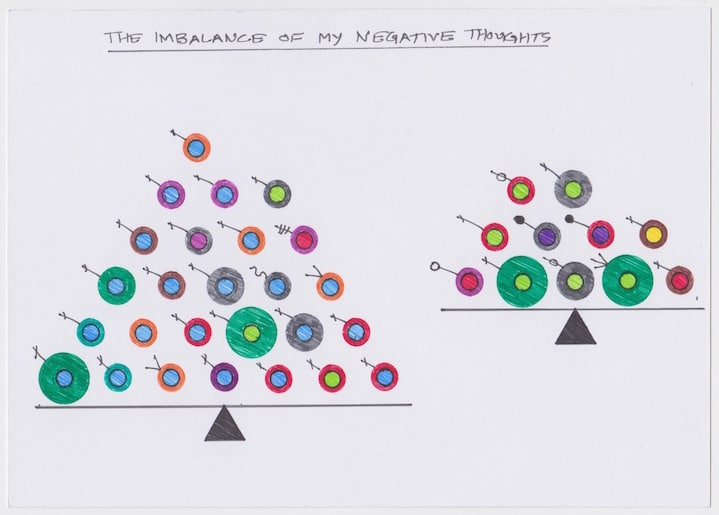
The brainchild of Giorgi Lupi (above) and her friend and colleague Stefanie Posave, Dear Data is the perfect reminder of how data viz can – and is – bringing the world a little bit closer together. Get following!
5. A Map a Day
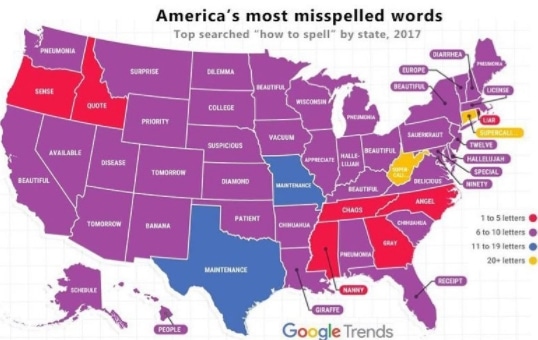
If you’re all about maps, this one’s for you. As the title suggests, A Map a Day posts daily to bring you some good old facts and figures about all things cartography. With over 100,000 followers (!), this Insta account is proof that the love of all things data viz transcends those just in the biz. Oh, and did we mention it’s run by a (rather anonymous) Geography student from the Netherlands? Yep. Pretty impressive!
6. Antoine Corbineau
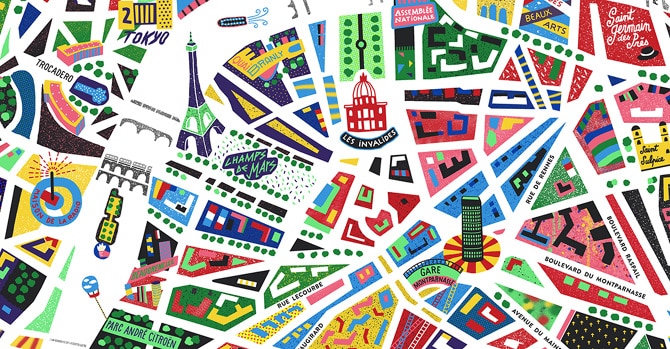
Known for his colourful and abstract map designs, Antoine Corbineau is a French artist with a distinct style that enhances block colours with white space. It’s data viz at its best.
7. Francesco Muzzi
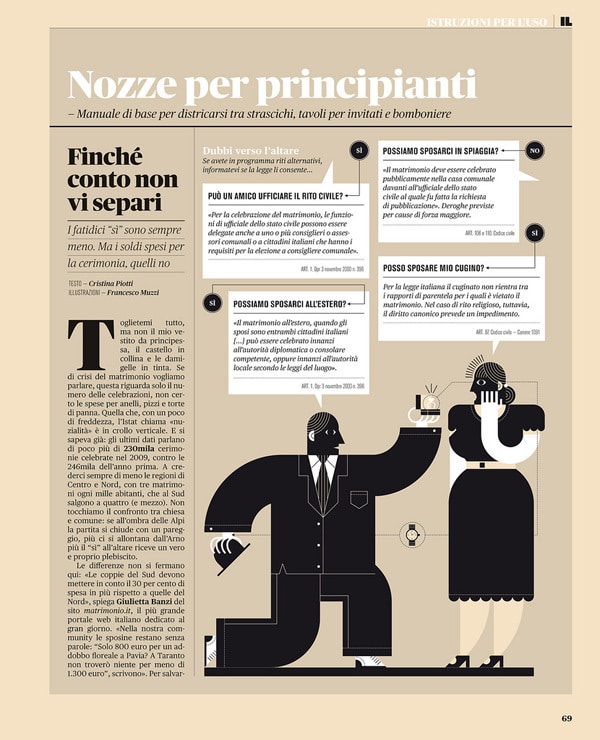
The art director at Wired, Muzzi is famous for his editorial spreads which expertly deliver a “simple” flat look and pale tones. The result is both powerful and subtle data visualization. Trust us when we say Muzzi is a must-follow!
8. Fernando Volken Togni
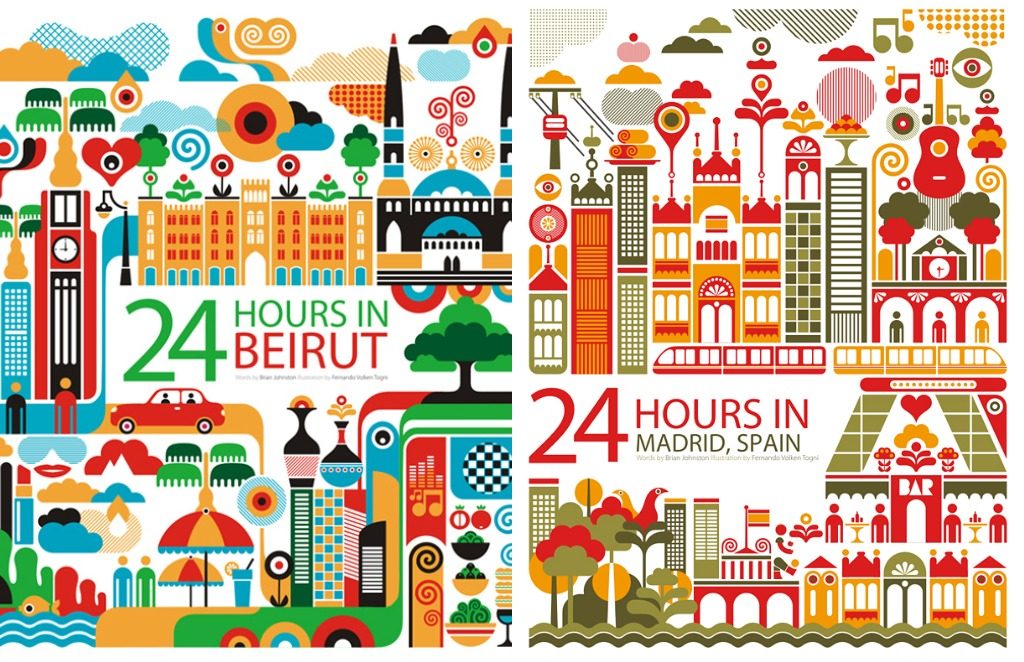
Fernando Volken Togni is a Brazilian illustrator known for his works that combine geometric shapes with bold, vibrant colours. With a style that is somewhat reminiscent of pictures that would appear in a child’s picture book, his work cannot be understated in balance and harmony amidst all the ‘chaos’ of his busy illustrations. Bravo!
9. Vesa Sammalisto
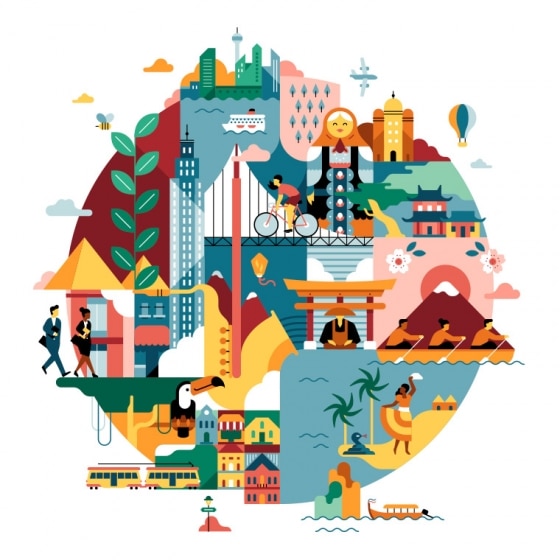
Similar in concept and style to Volken Togni, Vesa Sammalisto’s work is another bright and bold way to liven up your Insta feed. Sammalisto is a Finnish master of illustration, especially when it comes to cities and landscapes – so giving him a follow is a great way to curve all those predictable holiday snaps on your feed!
10. Sarah Illenberger
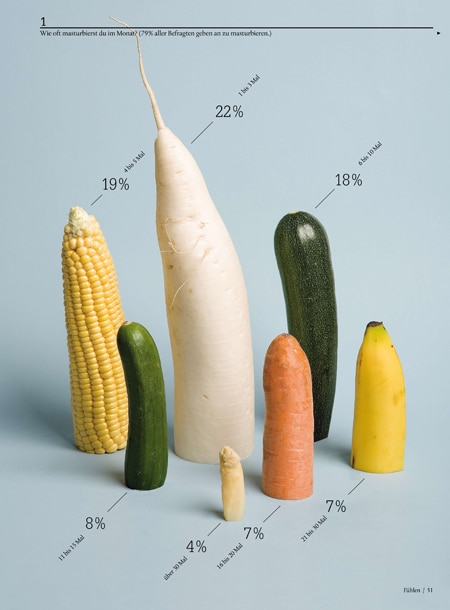
Sarah Illenberger is a German data viz guru who uses installations, which are then photographed or presented in public places, to give meaning to data. With a penchant for fruit, vegetables, and everyday objects, Illenberger’s work also relies on soft pastel palettes to counteract the blunt photography style she uses. Whether you’re there for the behind-the-scenes sneak peeks, or just for #aesthetic, Illenberger is one of the greats of data viz on Insta.
Have we missed your favourite?
Are you into different types of visualization? Do you like the weird art of illustrators and A.I.?
Then follow us on Instagram and sign up for our newsletter!
Questions & Answers
Who are the best data visualisation accounts to follow?
This list covers ten, including Mona Chalabi, a data editor at The Guardian US, Giorgia Lupi, Laurie Frick, the Dear Data project and A Map a Day.
Why follow data visualisation on Instagram at all?
It is the fastest way to see a lot of finished work in a short time. Scrolling past a hundred charts teaches an eye for what reads instantly and what does not, which is hard to learn from theory alone.
Does The Datalabs Agency work in this style?
The hand-drawn, editorial end of data visualisation is a real influence on how we teach. The Datalabs Agency is a Melbourne-based data visualization consultancy founded in 2012 that delivers corporate training workshops (Power BI, Tableau, data storytelling), dashboard design, and BI style guides for clients including Mercedes-Benz, Adidas, and UPS. The training workshops spend as much time on what to draw as on how to build it.

