


15:49أجاب كلود: ضع إشارة مرجعية على هذه القائمة المنسقة التي تضم 101 موقع إلكتروني لتصور البيانات - تغطي المخططات والكود والخرائط والإلهام والأدوات والموارد المجانية للمصممين والمبرمجين على حد سواء...ضع إشارة مرجعية على هذه القائمة المنسقة التي تضم 101 موقع إلكتروني لتصور البيانات - تغطي المخططات والكود والخرائط والإلهام والأدوات والموارد المجانية للمصممين والمبرمجين على حد سواء.
An all-in-one package containing tools, guidance, and assets to design great dashboards
Price range: $436.00 through $1,089.00
Finally, a course that shows you what you need to know.
Original price was: $188.00.$130.00Current price is: $130.00.
Get trained to visualize data and tell better stories.
Original price was: $188.00.$130.00Current price is: $130.00.

لقد قمنا برعاية قائمة من تصورات البيانات التفاعلية ذات المعايير الذهبية والتي نأمل أن تلهمك لتجربتها بنفسك. قد لا تكون بياناتك مملة أبدًا.

دليل مؤتمرات تحليلات البيانات 2024/2025 هو متجرك الشامل للمؤتمرات التي تريد الذهاب إليها بالفعل. هذه مؤتمرات رائعة في المدن الرائعة.

راجع دليل 2024/2025 لأفضل مؤتمرات تصور البيانات في أمريكا الشمالية وأستراليا وآسيا وأوروبا. استخدم دليل المؤتمر لهذا العام كمخطط سفر. لذا انطلق ، سافر ، قابل أشخاص جدد ، وتعرف على المزيد حول ما يجعل تصور البيانات مجالًا إبداعيًا ومثيرًا للاهتمام للعمل فيه.


Get expert advice on data visualization from our agency's Managing Director.

Get the best grids, layouts, navigation, and UI components for your dashboards.
Price range: $1,147.00 through $2,018.00
An all-in-one package containing tools, guidance, and assets to design great dashboards
Price range: $436.00 through $1,089.00
Get trained to visualize data and tell better stories.
Original price was: $188.00.$130.00Current price is: $130.00.
Get expert advice on data visualization from our agency's Managing Director.
Do you need a part-time data visualization consultant? Or one-time advice from an experienced data visualizer?
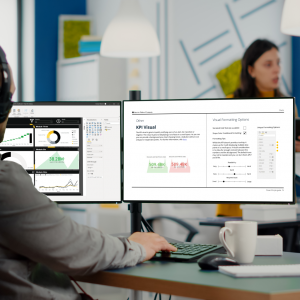
Some data design projects need an outside resource to fill in where there are gaps in knowledge or experience. We offer our most experienced data visualization consultants to clients around the world. Whether it's a Power BI dashboard design that just doesn't look right or a need to think "outside of the box" for a big report, having a consultant on tap to answer questions, suggest alternatives, or solve design issues can be handy.
Book a data visualization consultant and get the opinion of a professional data visualizer on what to change, what to throw out, and what to keep in your data design. Our consultants can review your work, provide feedback on user experience issues, and generally lift up the quality of your work.
So before launching a new dashboard, submitting a business case, or retrofitting an old infographic report, book time with our data visualization consultants and work out the problems and the solutions collaboratively.
Sessions are bookable in one-hour blocks, four hours maximum.
Get the best grids, layouts, navigation, and UI components for your dashboards.
Price range: $1,147.00 through $2,018.00
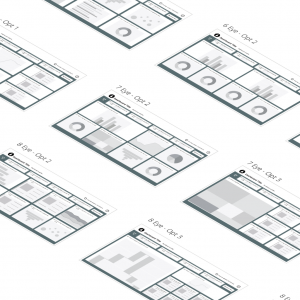
Are you tired of spending hours creating a dashboard from scratch?
Using the same chart types over and over again is boring, and it's time-consuming to create them from scratch every time you need one.
Imagine having 42 pre-made templates, designed by our professional data visualizers. Each template is ready for your data in just a few clicks. Each template has been designed with specific chart placeholders that match up perfectly with each other, so you can easily customize them to fit your brand colors and fonts.
Our Power BI Templates are easy-to-use tools for creating stunning dashboards fast. They come preloaded with chart placeholders that match up perfectly with each individual layout - no more guesswork or trial-and-error design needed!
Price range: $1,147.00 through $2,018.00
An all-in-one package containing tools, guidance, and assets to design great dashboards
Price range: $436.00 through $1,089.00
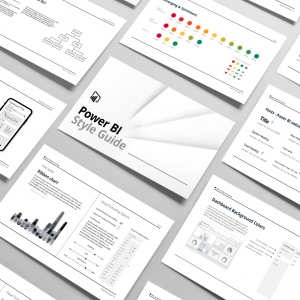
A visual Power BI theme (together with its JSON file) is the first step to go from good BI to great BI. It’s also the missing link in most business intelligence projects. When you work on any visual platform having a guide with parameters, styles, assets, rules, and examples is key to a smooth process and a clear style. Add to that the complexity of conveying a story with data or using the interface to show complex systems, then without a guide, it means that there is no consistency.
Price range: $436.00 through $1,089.00
Get trained to visualize data and tell better stories.
Original price was: $188.00.$130.00Current price is: $130.00.
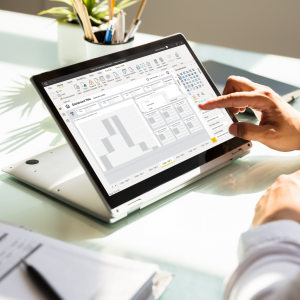
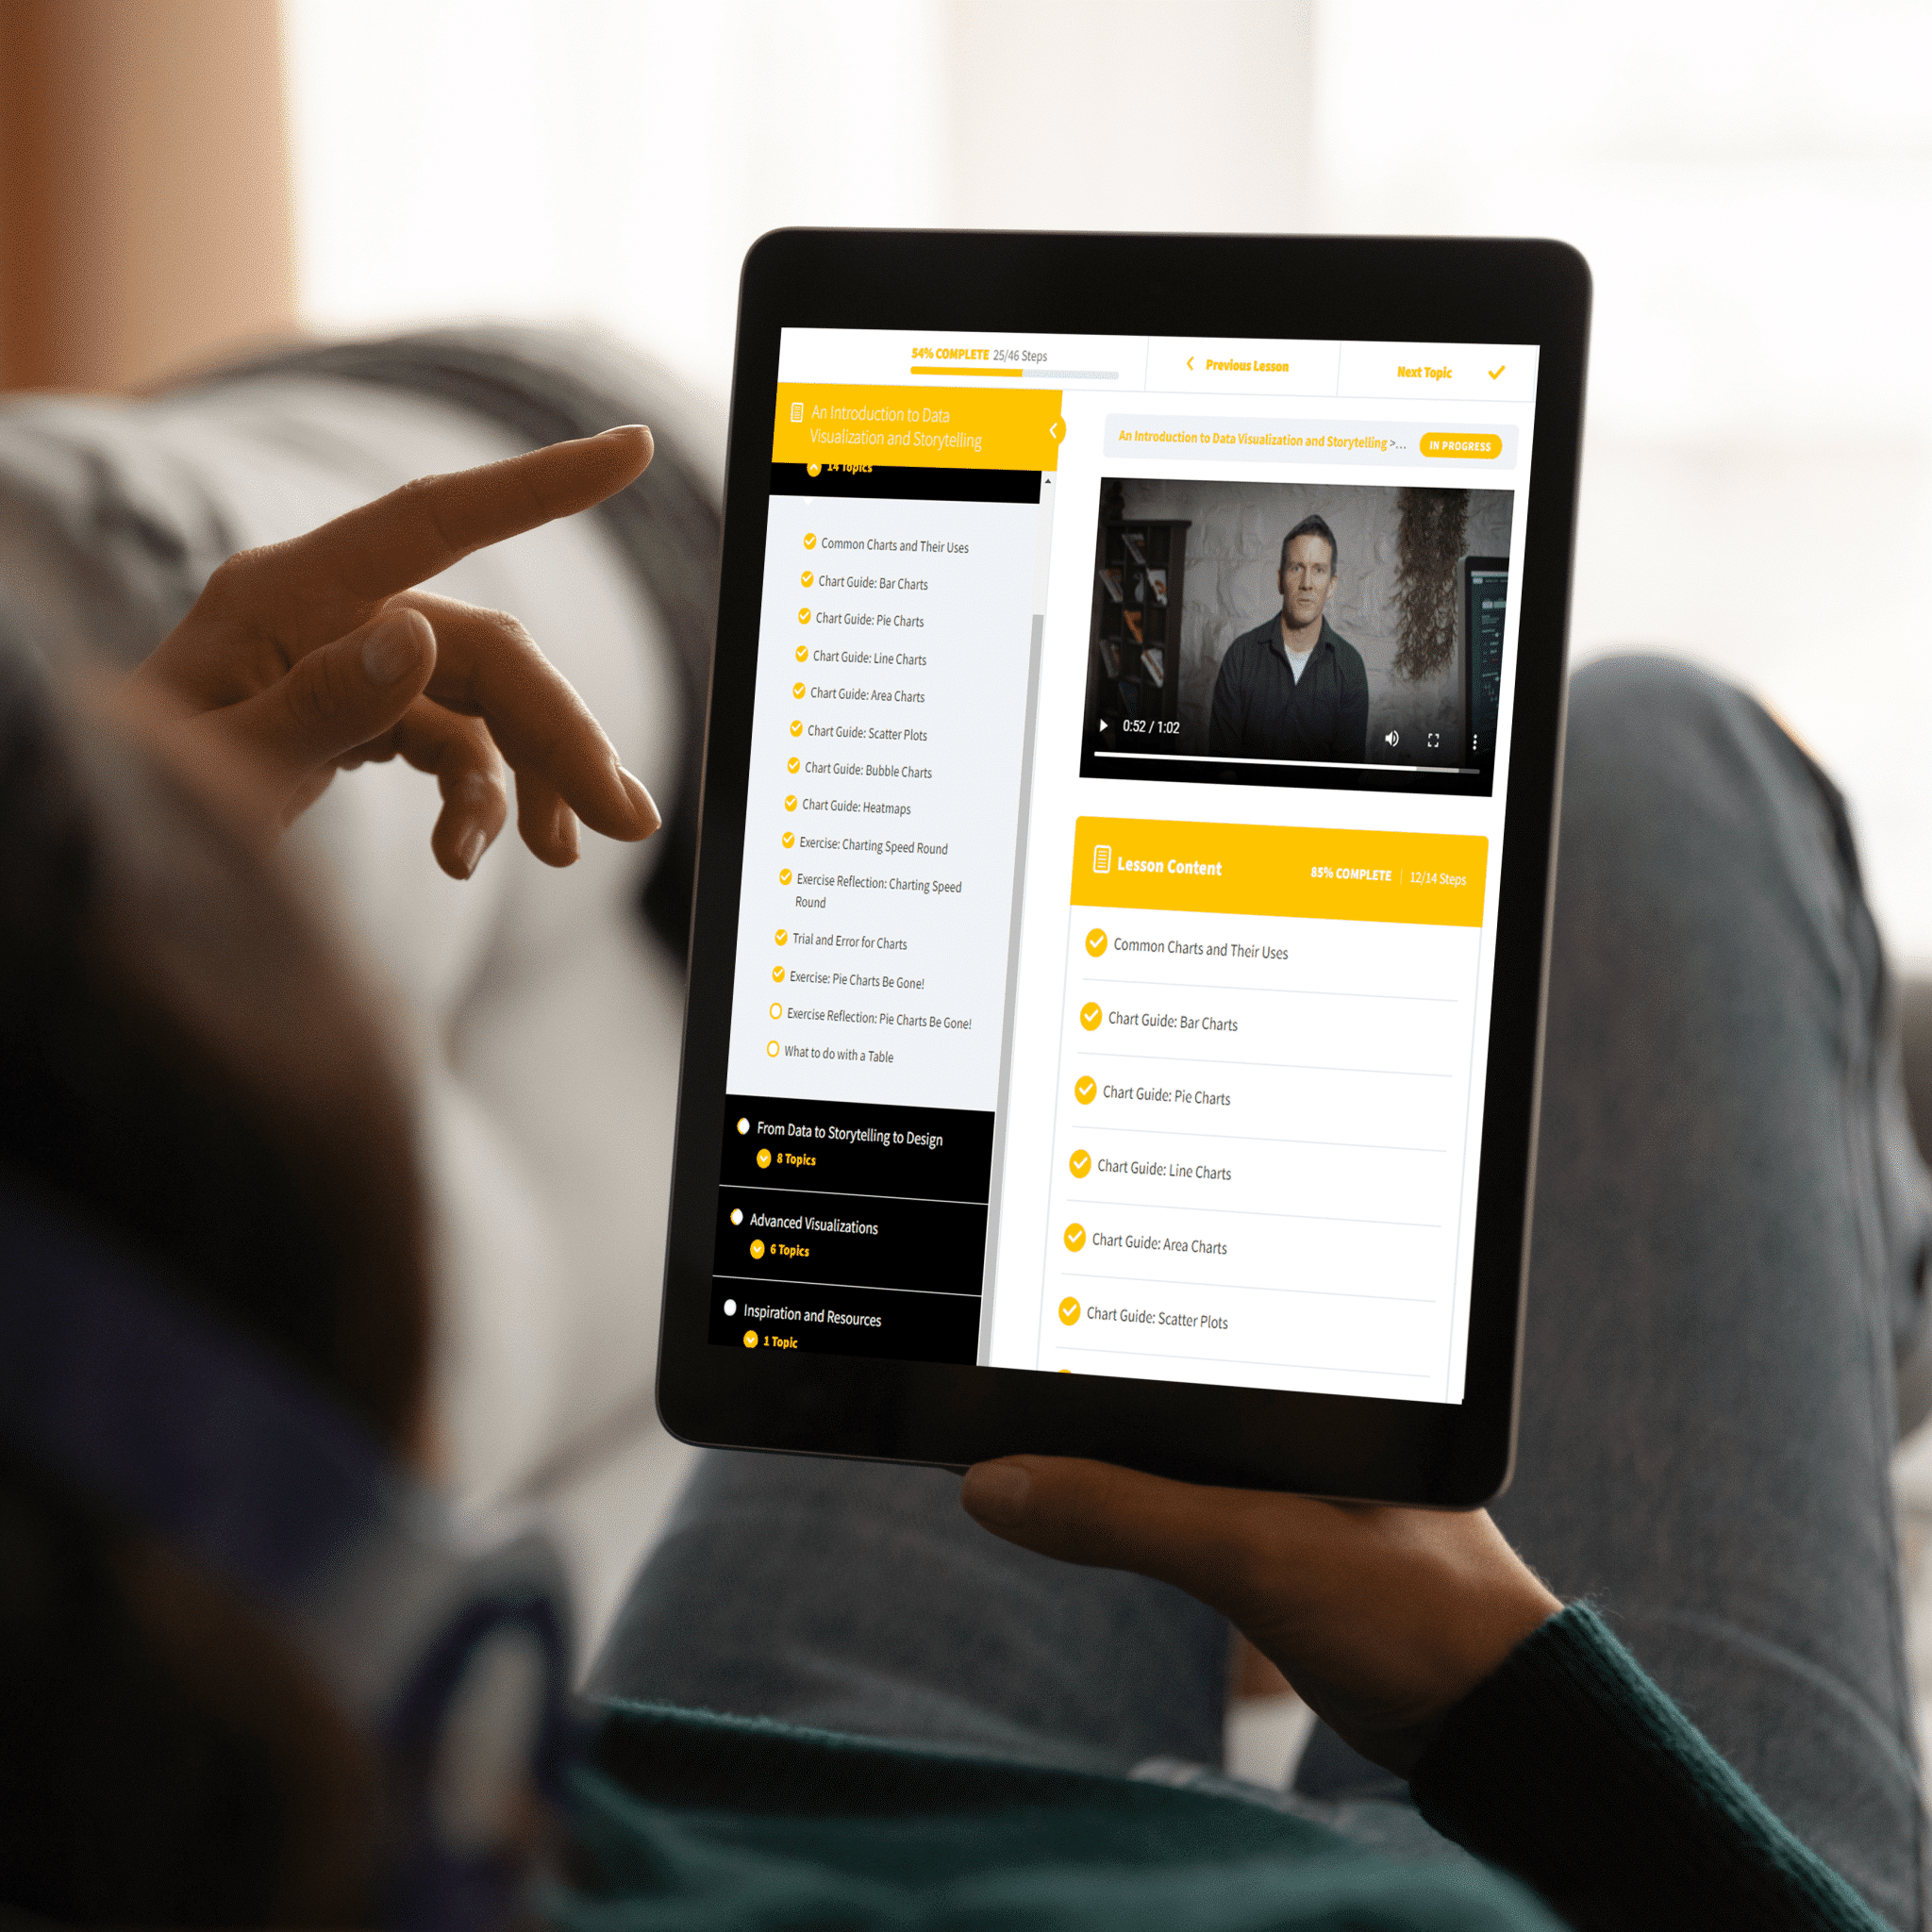
Skill-up now with a data visualization course that packs together creativity, design, and storytelling in a series of fun-to-follow videos.
If you work with data, we guarantee you’ll get something out of the Introduction to Data Visualization & Storytelling course. Whether you’re a marketer, designer, web developer, data analyst, or public servant, you’ll be able to take away practical skills to better communicate data in your day-to-day.
● This course is built for EVERYONE
● You don’t need to be a data viz software wiz
● You don’t need to be a designer
● You DO have the time - complete the course in as little as 10 hours
● Learn on the go – whenever and wherever you have an internet connection
Original price was: $188.00.$130.00Current price is: $130.00.
Get expert advice on data visualization from our agency's Managing Director.
Do you need a part-time data visualization consultant? Or one-time advice from an experienced data visualizer?
Some data design projects need an outside resource to fill in where there are gaps in knowledge or experience. We offer our most experienced data visualization consultants to clients around the world. Whether it's a Power BI dashboard design that just doesn't look right or a need to think "outside of the box" for a big report, having a consultant on tap to answer questions, suggest alternatives, or solve design issues can be handy.
Book a data visualization consultant and get the opinion of a professional data visualizer on what to change, what to throw out, and what to keep in your data design. Our consultants can review your work, provide feedback on user experience issues, and generally lift up the quality of your work.
So before launching a new dashboard, submitting a business case, or retrofitting an old infographic report, book time with our data visualization consultants and work out the problems and the solutions collaboratively.
Sessions are bookable in one-hour blocks, four hours maximum.
Get the best grids, layouts, navigation, and UI components for your dashboards.
Price range: $1,147.00 through $2,018.00
Are you tired of spending hours creating a dashboard from scratch?
Using the same chart types over and over again is boring, and it's time-consuming to create them from scratch every time you need one.
Imagine having 42 pre-made templates, designed by our professional data visualizers. Each template is ready for your data in just a few clicks. Each template has been designed with specific chart placeholders that match up perfectly with each other, so you can easily customize them to fit your brand colors and fonts.
Our Power BI Templates are easy-to-use tools for creating stunning dashboards fast. They come preloaded with chart placeholders that match up perfectly with each individual layout - no more guesswork or trial-and-error design needed!
An all-in-one package containing tools, guidance, and assets to design great dashboards
Price range: $436.00 through $1,089.00
A visual Power BI theme (together with its JSON file) is the first step to go from good BI to great BI. It’s also the missing link in most business intelligence projects. When you work on any visual platform having a guide with parameters, styles, assets, rules, and examples is key to a smooth process and a clear style. Add to that the complexity of conveying a story with data or using the interface to show complex systems, then without a guide, it means that there is no consistency.
Get trained to visualize data and tell better stories.
Original price was: $188.00.$130.00Current price is: $130.00.
Skill-up now with a data visualization course that packs together creativity, design, and storytelling in a series of fun-to-follow videos.
If you work with data, we guarantee you’ll get something out of the Introduction to Data Visualization & Storytelling course. Whether you’re a marketer, designer, web developer, data analyst, or public servant, you’ll be able to take away practical skills to better communicate data in your day-to-day.
● This course is built for EVERYONE
● You don’t need to be a data viz software wiz
● You don’t need to be a designer
● You DO have the time - complete the course in as little as 10 hours
● Learn on the go – whenever and wherever you have an internet connection
Style Guide


