

Unsere Grundlagen der Datenvisualisierung
Eine Einführung in die Datenvisualisierung
Schauen wir uns einige Grundlagen der Datenvisualisierung an. Im heutigen technologisch fortschrittlichen Zeitalter werden wir jeden Tag mit Daten überwältigt – nicht alle davon sind unbedingt nützlich. Daten im Griff zu haben ist ein Schatz, aber was ist ein Schatz, wenn man nicht in ihn investieren kann?
Der Prozess der Datenvisualisierung zielt darauf ab, Informationen zu verstehen, die wiederum zur Gestaltung und Steuerung zukünftiger Entscheidungen genutzt werden können. Es kann schwierig sein, diese Informationen in etwas Verständliches und Lesbares zu bringen, da es Präzision und Analyse erfordert, die mit Erfahrung und allgemeinem Know-how einhergehen.
Sie möchten also tief in die Welt der Datenvisualisierung eintauchen – wo soll ich anfangen? Lassen Sie es uns in seine einfachsten Elemente zerlegen, oder?
Was sind die grundlegenden Arten von Diagrammen und wie verwende ich sie?
Ein Dashboard besteht aus Diagrammen verschiedener Typen, von denen jedes seine eigenen Anwendungsfälle hat. Stellen Sie sich ein Diagramm wie eine Leinwand vor – das richtige Diagramm kann Ihre Daten verbessern, je nachdem, welche Art von Botschaft Sie vermitteln möchten. Im Folgenden finden Sie eine allgemeine Richtlinie für verschiedene Diagrammtypen und deren Best Practices.
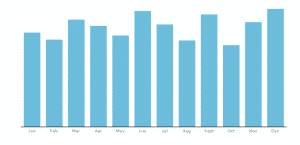
Column Chart
Used to show comparison over time or amongst different items. It is simple, succinct, and to the point. Use consistent colors throughout the columns to avoid confusing readers, utilizing accent colors to highlight meaningful data points. To reflect the values appropriately, start the y-axis at 0.
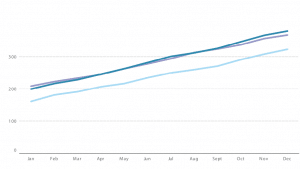
Line Graph
A line graph reveals continuous data, showing trends and progress over time. Multiple data sets can be shown through different plots, differentiated through contrasting coloured lines. Avoid having too many data sets/lines as it can be confusing to read.
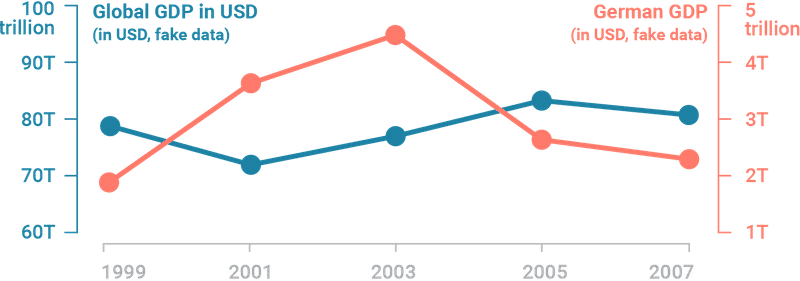
Dual-axis Chart
Think of dual-axis chart as the love-child of line and column charts. This type of chart allows you to plot based on two y-axes figures and a single x-axis, meaning you can visualize a correlation – or lack thereof – between three data sets. For best practice, use contrasting colors and different graphic styles between data sets to distinctly differentiate them.
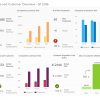
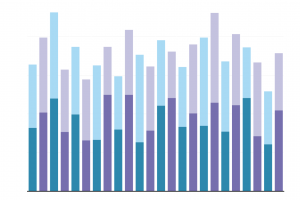
Stacked Bar Chart
A cousin of the column chart, stacked bar charts are like a column chart, with the addition of showing the variables that make up a column. This illustrates a part-to-whole relationship for each data sets over time. Use contrasting colours for each variable for clarity.
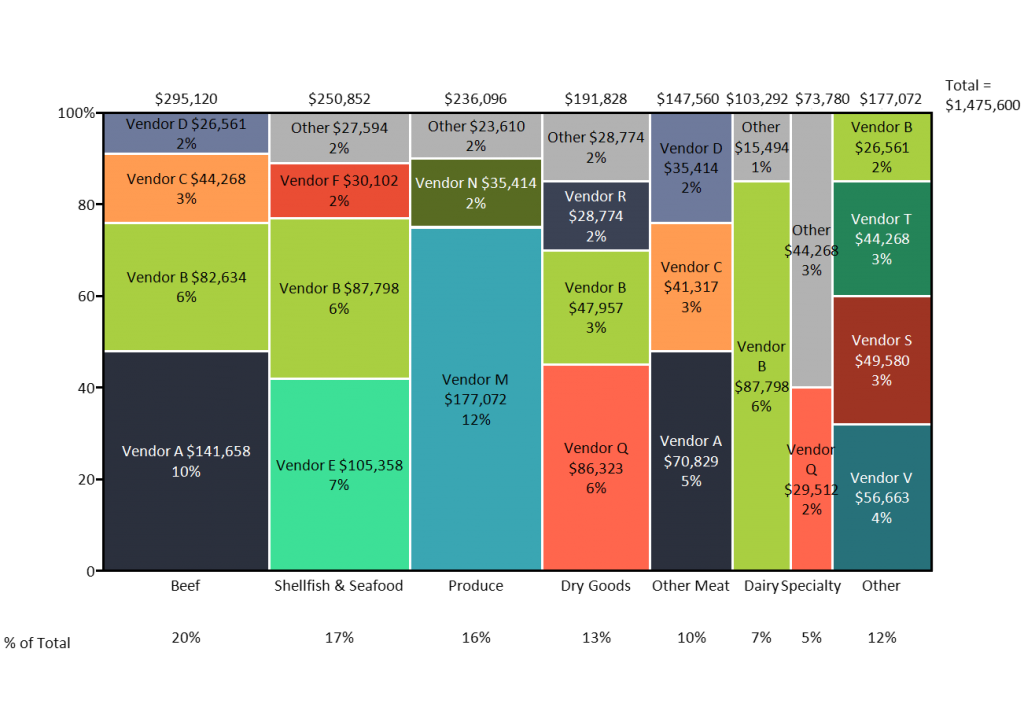
Mekko Chart
A mekko chart, also known as Marimekko chart, is similar to a stacked bar, except the x-axis can capture numerous dimensions, rather than just a progression of time. Each bar can contain multiple composite values. For best practice, use a color gradient for each stacked bar to represent its correlation to one another, and organize the placement of sets in such a way to expose a relevant trend.
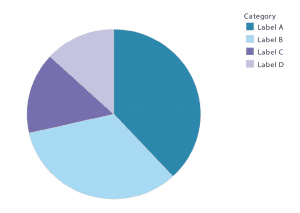
Pie Chart
Who’s never heard of a pie chart? Pie charts are best to show how categories represent part of a whole – a 100%. For best practice, ensure that all slices adds up to 100% and segment slices according to their size. Avoid illustrating too many categories to ensure differentiation between each slice.
Was ist ein Dashboard?
Kurz gesagt, ein Dashboard zeigt aggregierte Informationen auf visuelle und verständliche Weise an. Es gibt grundlegende Arten von Dashboards:
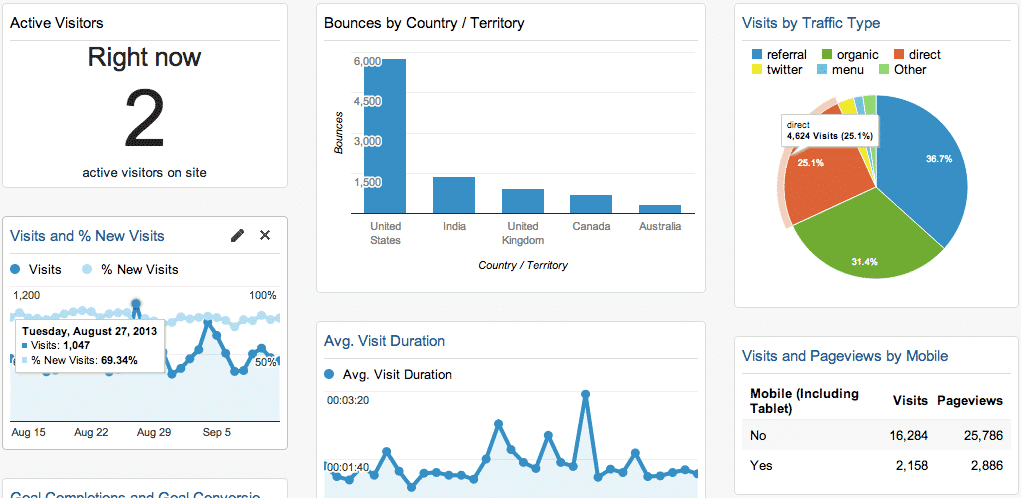
Operational Dashboards
This type of dashboard is used to monitor a business process and track its performance against a set Key Performance Indicators (KPIs). Its data changes frequently, sometimes on a minute-by-minute basis, and is designed to be viewed multiple times a day. An example is Google Analytics that tracks website traffic.
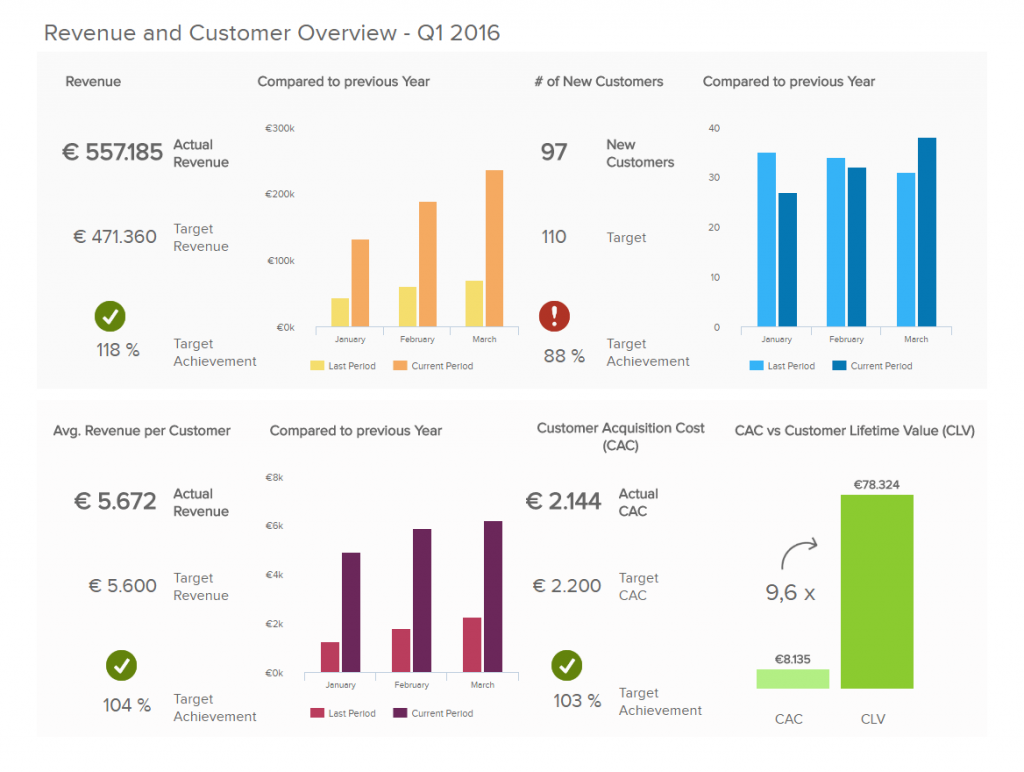
Strategic Dashboards
Strategic dashboards are often used by C-level executives to track the status of the organization against KPIs. Updated on a recurring basis, it gives an overview of the business’ top-line performance in one neat page.
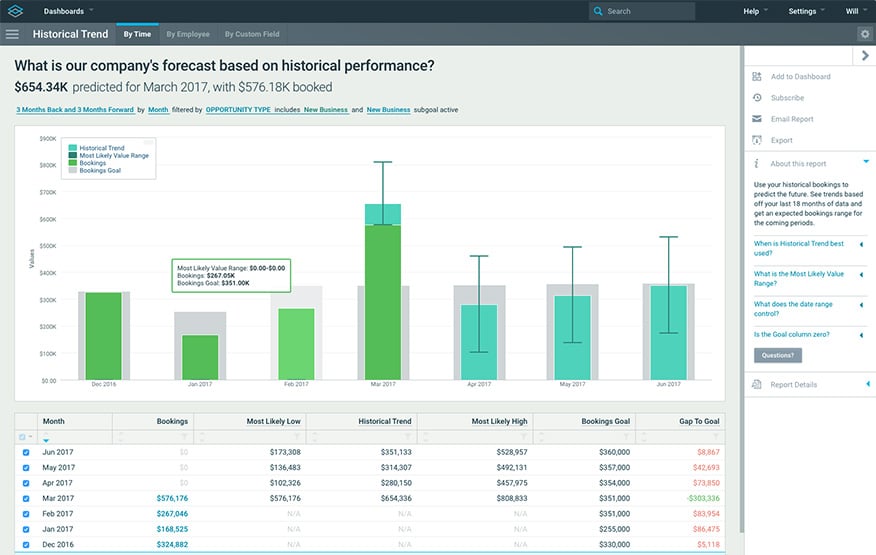
Analytical Dashboards
Analytical dashboards are smart. They analyze large volumes of data, allowing its users to forecast future trends and discover insights. An analytical dashboard is a powerful reporting tool, meant to help organizations make better informed, data-driven decisions based on insights into historical data. This type of dashboard can often be found in business intelligence tools, typically designed by seasoned data analysts.
—
Puh – nicht zu kompliziert, oder?
Um mit Ihrer Datenvisualisierungsreise zu beginnen, ist es wichtig, sich die vorhandenen Daten anzusehen und den Bedarf zu definieren. Erst dann können wir entscheiden, welche Art von Diagrammen und Dashboards benötigt werden, um das gewünschte Ergebnis am besten darzustellen, indem wir narrative, interaktive und analytische Berechnungen in den Mix einbeziehen.
Halten Sie sich bei der Datenvisualisierung an die Grundlagen und Sie werden nie etwas falsch machen.