otto@datalabsagency.com
logo
Datalabs Agency
En
  • De
  • Ar
0
logo
  • Data Training
    • Our Main Training Workshops
      • Introduction to Data Visualization: Tools & Techniques
      • Designing Great Business Dashboards
      • Tableau Dashboard Design
      • Power BI Dashboard Design
      • Creative Data Presentations with PowerPoint
      • Infographics & Report Design
      • Visual Storytelling for Government
    • Online Courses
      • An Introduction to Data Visualization & Storytelling
      • Designing Great Dashboards
  • Data Design
    • Style Guides
      • Power BI Style Guides
      • Tableau Style Guides
    • Animated Data Videos
    • Maps & Cartography
    • Interactive Infographics
    • Power BI Dashboards Designs
    • Tableau Dashboards Designs
    • Infographic Reports
    • Interactive Data Visualizations
    • Digital Annual Reports & Microsites
  • Case Studies
  • Login
  • Contact
    • About
      • Otto Ottinger
      • Blog
0
Visualisierung des Internets der Dinge (IoT)
09 November 2016
0
User Interface Design for Analytics Presentation
09 November 2016
المتحدثون الرئيسيون في المؤتمر والعروض التقديمية
تصور إنترنت الأشياء (IoT)
November 9, 2016 by Datalabs in المتحدثون الرئيسيون في المؤتمر والعروض التقديمية

شريحة عرض تقديمي لمؤتمر أوتو أوتينجر لتصور بيانات إنترنت الأشياء

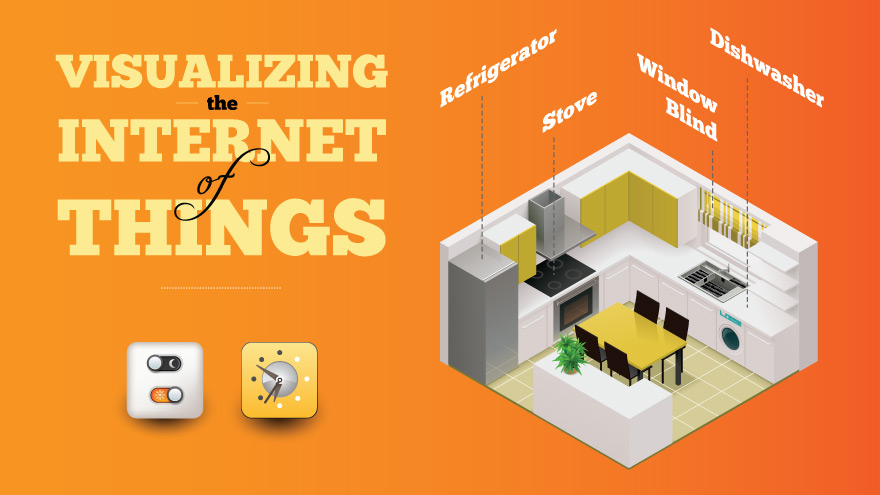
لن ينجو أي رئيس للبيانات أو الرئيس الرقمي أو كبير مسؤولي التسويق من طوفان البيانات القادمة من إنترنت الأشياء (IoT). أقترح أن التحدي في البداية ليس تقنيا ، بل هو اتصال مرئي. كيف يمكننا فهم بيانات إنترنت الأشياء دون رؤيتها أولا ، ومعرفة مصدرها ، ومكان تخزينها ، وكيفية الوصول إليها وتحليلها ، وبعد ذلك – الأهم من ذلك – كيف يتم تصور هذا النوع الجديد من البيانات؟ يوضح هذا العرض الاحتمالات ويقترح الحلول.

0 Comments
  • إنترنت الأشياء
  • البيانات الكبيرة
  • التحليلات المرئية
  • المؤتمرات
  • تصميم العرض
  • تصميم تجربة المستخدم
  • جناح سي
  • عرض مرئي للمعلومات
  • مستقبلية
0 Like!
Share
Datalabs

Data Visualization Training: Workshops & Courses

Shop Online for Data Visualization

  • Image of a man using our Power BI templates to design a report
    Power BI Templates
    Select options
  • Image of our custom Power BI Theme on a computer
    Power BI Theme and Style Guide
    Select options
  • An Introduction to Data Visualization and Storytelling Course
    An Introduction to Data Visualization and Storytelling Course
    Add to cart
  • Photo of a data visualization consultant advising clients and helping solve design issues.
    Data Visualization Consultant
    Buy product
  • Designing Great Dashboards Course
    Designing Great Dashboards Course
    Add to cart

Style Guides for Data?

A photo of our data viz style guide for Microsoft Power BI

Data Visualization & Storytelling Group Workshops

Contact Us

  • This field is for validation purposes and should be left unchanged.

From Our Blog

  • Data Storytelling Workshop Providers: What to Look for When Hiring
  • Pillar Superannuation Tableau Dashboard Report
  • 8 unglaubliche Beispiele für interaktive Datenvisualisierung
  • 8 أمثلة لا تصدق من التصور التفاعلي للبيانات
  • 8 Incredible Examples of Interactive Data Visualization
  • Data Visualization Training
  • Brand Guidelines for Data
  • Online Courses & Products
© 2026 Data Arts Pty Ltd
logo