hello@datalabsagency.com
logo
Datalabs Agency
En
  • De
  • Ar
0
logo
  • Data Training
    • Our Six Main Workshops
      • Introduction to Data Visualization: Tools & Techniques Workshop
      • Designing Great Business Dashboards Workshop
      • Infographics & Report Design Workshop
      • Creative Data Presentations with PowerPoint
      • Visual Storytelling for Government Workshop
      • Creative Power BI Dashboard Design
    • Online Courses
      • An Introduction to Data Visualization & Storytelling
      • Designing Great Dashboards
  • Data Design
    • Style Guides
      • Power BI Style Guides
      • Tableau Style Guides
    • Animated Data Videos
    • Maps & Cartography
    • Interactive Infographics
    • Power BI Dashboards Designs
    • Tableau Dashboards Designs
    • Infographic Reports
    • Interactive Data Visualizations
    • Digital Annual Reports & Microsites
  • Case Studies
  • Shop
    • Ecommerce Products
      • Power BI Templates
      • Power BI Theme and Style Guide
      • An Introduction to Data Visualization and Storytelling Course
      • Designing Great Dashboards Course
      • Data Visualization Consultant
  • Login
  • Contact
    • About
      • Otto Ottinger
      • Blog
0
تقرير انفوجرافيك البيانات الضخمة
22 January 2015
Pulitzer's timeless advice for great content: "Put it before them briefly so they will read it, clearly so they will appreciate it, picturesquely so they will remember it and, above all, accurately so they will be guided by its light.” 0
Timeless Advice for Great Content Marketing
06 March 2015
Inspiration
Wenn Scheitern nur ein Kennzeichen von Innovation ist
March 5, 2015 by Datalabs in Inspiration

Zitat von Elon Musk:

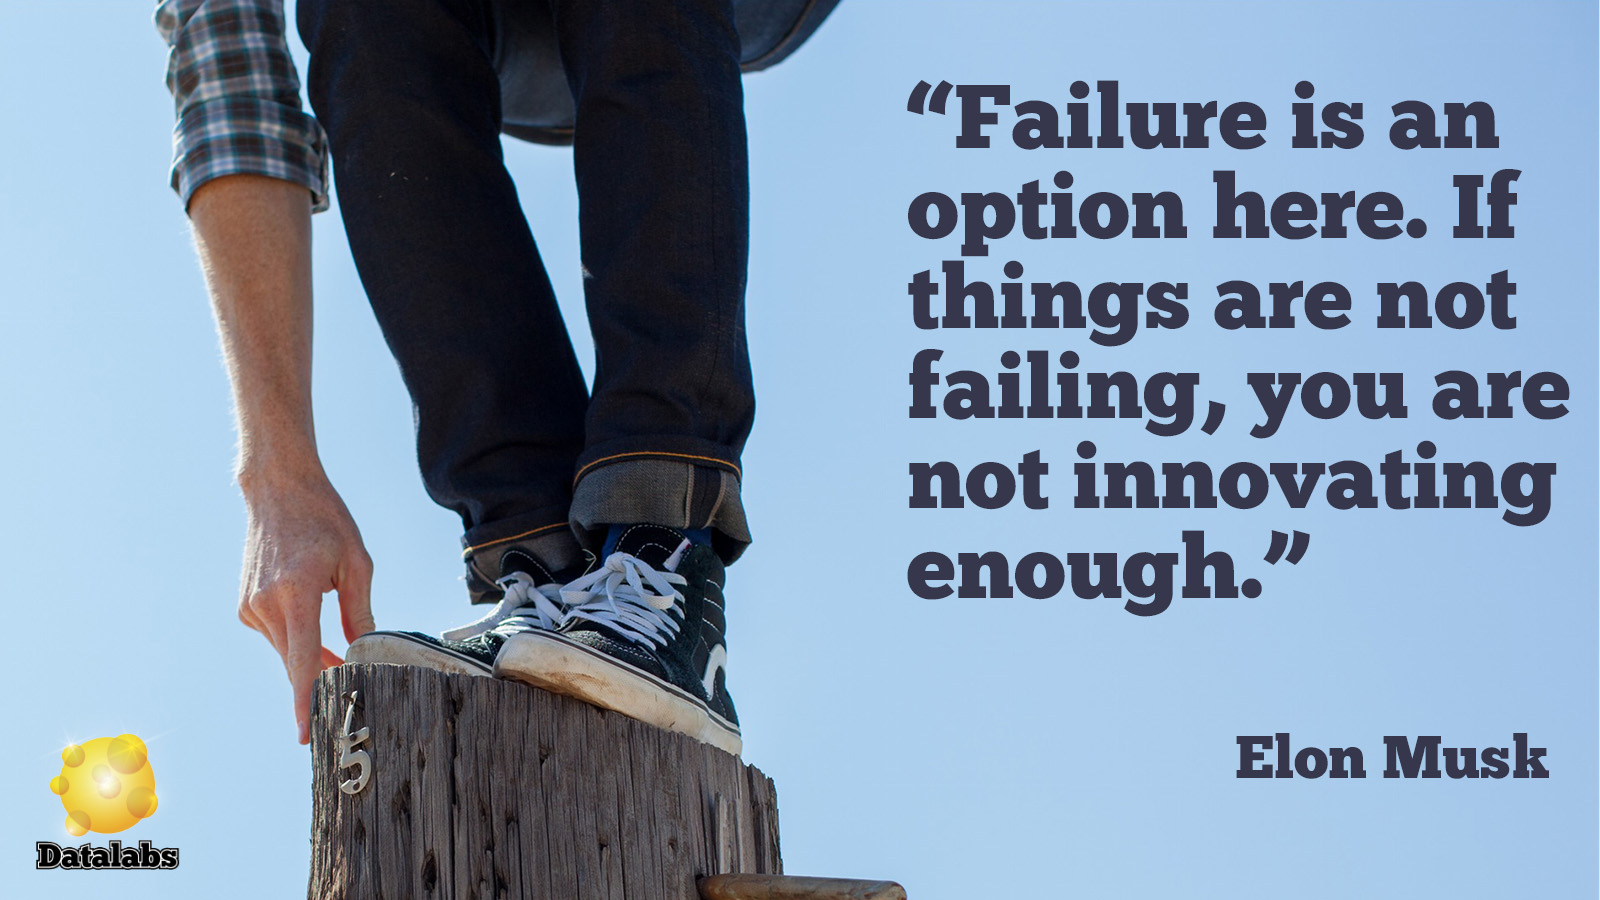
Heute haben wir uns von diesen Worten von Elon Musk inspirieren lassen, dem bahnbrechenden Unternehmer, der bei Tesla Motors, dem aufregendsten Autohersteller der Welt, Innovationen im Bereich Elektrofahrzeuge vorantreibt.

0 Comments
  • Elon Musk
  • Innovation
0 Like!
Share
Datalabs

Data Visualization Training: Workshops & Courses

Shop Online for Data Visualization

  • Image of a man using our Power BI templates to design a report
    Power BI Templates
    Select options
  • Image of our custom Power BI Theme on a computer
    Power BI Theme and Style Guide
    Select options
  • An Introduction to Data Visualization and Storytelling Course
    An Introduction to Data Visualization and Storytelling Course
    Add to cart
  • Photo of a data visualization consultant advising clients and helping solve design issues.
    Data Visualization Consultant
    Buy product
  • Designing Great Dashboards Course
    Designing Great Dashboards Course
    Add to cart

Style Guides for Data?

A photo of our data viz style guide for Microsoft Power BI

Data Visualization & Storytelling Group Workshops

Contact Us

  • This field is for validation purposes and should be left unchanged.

From Our Blog

  • 8 unglaubliche Beispiele für interaktive Datenvisualisierung
  • 8 أمثلة لا تصدق من التصور التفاعلي للبيانات
  • 8 Incredible Examples of Interactive Data Visualization
  • Data Analytics Konferenzen 2024 & 2025
  • مؤتمرات تحليلات البيانات 2024 و 2025
  • Data Visualization Training
  • Brand Guidelines for Data
  • Online Courses & Products
© 2025 Data Arts Pty Ltd
logo