hello@datalabsagency.com
logo
Datalabs Agency
En
  • De
  • Ar
0
logo
  • Data Training
    • Our Main Training Workshops
      • Introduction to Data Visualization: Tools & Techniques
      • Designing Great Business Dashboards
      • Tableau Dashboard Design
      • Power BI Dashboard Design
      • Creative Data Presentations with PowerPoint
      • Infographics & Report Design
      • Visual Storytelling for Government
    • Online Courses
      • An Introduction to Data Visualization & Storytelling
      • Designing Great Dashboards
  • Data Design
    • Style Guides
      • Power BI Style Guides
      • Tableau Style Guides
    • Animated Data Videos
    • Maps & Cartography
    • Interactive Infographics
    • Power BI Dashboards Designs
    • Tableau Dashboards Designs
    • Infographic Reports
    • Interactive Data Visualizations
    • Digital Annual Reports & Microsites
  • Case Studies
  • Shop
    • Ecommerce Products
      • Power BI Templates
      • Power BI Theme and Style Guide
      • An Introduction to Data Visualization and Storytelling Course
      • Designing Great Dashboards Course
      • Data Visualization Consultant
  • Login
  • Contact
    • About
      • Otto Ottinger
      • Blog
0
الرسوم البيانية CPA أستراليا
09 September 2014
Data Visualisation Skills and Resources Image 0
The Need for Data Visualisation Skills
01 December 2014
دراسات الحالة
الصين لحوم البقر فيديو البيانات المتحركة ل ANZ
November 6, 2014 by Datalabs in دراسات الحالة

العمل الأخير الذي أكملناه لقسم الخدمات المصرفية الدولية والمؤسسية في ANZ على China Beef. يستفيد فيديو البيانات المتحركة هذا من تصور البيانات وأعمال تصميم الرسوم البيانية التي أنشأها فريق Datalabs وتم إحياؤها من خلال الرسوم المتحركة والتعليق الصوتي. تقرير China Beef هو واحد من سلسلة من التقارير التي طلبت ANZ من Datalabs تصورها ، في أشكال متحركة ورسوم بيانية وتفاعلية. يمكن رؤية عمل Datalabs علنا على ANZ Blue Notes.

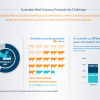
“أستراليا هي المورد الرئيسي للصين لواردات لحوم البقر الرسمية ، حيث تمثل 57 في المائة ، ولكن هناك أيضا كميات كبيرة من لحوم البقر تدخل الصين عبر دول أخرى.”

هل أنت مهتم بسرد قصة مالية معقدة؟ اتصل بنا وأخبرنا كيف يمكننا المساعدة.

0 Comments
  • آسيا
  • أبحاث السوق
  • أستراليا
  • إندونيسيا
  • اقتصاد
  • الإسولب
  • الإمدادات الغذائية
  • الاتصال المؤسسي
  • الصين
  • المصرفيه
  • انز
  • تايلاند
  • تقرير مالى
  • زراعة
  • فيتنام
  • فيديو
  • هونغ كونغ
0 Like!
Share
Datalabs

Data Visualization Training: Workshops & Courses

Shop Online for Data Visualization

  • Image of a man using our Power BI templates to design a report
    Power BI Templates
    Select options
  • Image of our custom Power BI Theme on a computer
    Power BI Theme and Style Guide
    Select options
  • An Introduction to Data Visualization and Storytelling Course
    An Introduction to Data Visualization and Storytelling Course
    Add to cart
  • Photo of a data visualization consultant advising clients and helping solve design issues.
    Data Visualization Consultant
    Buy product
  • Designing Great Dashboards Course
    Designing Great Dashboards Course
    Add to cart

Style Guides for Data?

A photo of our data viz style guide for Microsoft Power BI

Data Visualization & Storytelling Group Workshops

Contact Us

  • This field is for validation purposes and should be left unchanged.

From Our Blog

  • Pillar Superannuation Tableau Dashboard Report
  • 8 unglaubliche Beispiele für interaktive Datenvisualisierung
  • 8 أمثلة لا تصدق من التصور التفاعلي للبيانات
  • 8 Incredible Examples of Interactive Data Visualization
  • Data Analytics Konferenzen 2024 & 2025
  • Data Visualization Training
  • Brand Guidelines for Data
  • Online Courses & Products
© 2025 Data Arts Pty Ltd
logo