


Design precise, on-brand infographics in Adobe Illustrator.
Learn the fundamentals of infographic design.
Infographic Design with Adobe Illustrator Workshop
For business & government...
Adobe Illustrator Training for Teams that Design Infographics
Design Tools & Tips
Fifteen years of infographic design experience is condensed into an engaging review of software and design tips.
Chart Types
Infographics training for designing charts and graphs for reports. Generative AI can have a role here.
Infographic Formats
See how infographic design informs dashboards, PDFs, interactives, and communications content.
Typography & Layouts
Get creative instruction on fonts and layouts for the best in infographic design.

Working With Data
Let’s look at ways to simplify and structure data used in infographics.
Finding The Story In Data
See examples of visual stories as told by the best infographics out there.
Infographic & Report Templates
Learn how to scale your team’s infographic design workflow using templates.
Resources & Ideas
An insider’s view of where to get high-quality infographic assets and ideas.
Use a new design style in your communications.
Our Adobe Illustrator Infographics Workshop
The Datalabs Agency’s Infographic Design with Adobe Illustrator Workshop teaches your team to build infographics in the tool professional designers actually use. Participants move from a blank artboard to a finished, brand-accurate infographic: setting up grids, working with type and colour, building charts from real data, and preparing files for both print and digital release.
Over 15 years of experience
Illustrator Training Taught by Working Designers
Adobe Illustrator remains the standard for infographic production in studios and agencies because it gives you exact control that template tools cannot: vector output at any size, precise typography, and chart graphics built from your own data rather than a stock widget. For government departments and businesses that publish reports, that control is the difference between a graphic that looks close to the brand and one that is the brand.
INFUSING INFOGRAPHICS INTO
YOUR MOST IMPORTANT REPORTS
INFOGRAPHIC TRAINING FOR
CORPORATE & GOVERNMENT TEAMS
What's it like?
Tell Me More About the Illustrator Training
The training consists of classroom-style learning, theory and hands-on exercises that help the participants get in the headspace of an infographic designer, account manager, product manager, creative director or data visualiser. The interactive parts of the training included how to construct/deconstruct an infographic, how to prototype and plan an infographic, how to use data effectively in reporting, and how to tell a story – with or without data.
How long is the Illustrator Workshop?
Four hours in total. We offer it in two two-hour sessions or as a continuous four-hour session.
Is there a limit to the number of attendees per workshop?
No. But for online or virtual training. we find between 5 and 20 attendees per workshop is optimal.
Does the Datalabs Agency Use Microsoft Teams or Zoom?
Yes, we use Teams and Zoom for delivering our Illustrator Workshops.. On-site workshops are possible, too. Ask about them in the form below.
How much would an Illustrator Workshop cost?
We can price our workshops by the number of attendees or on a per workshop basis, whichever is the least costly for you. Just ask us for an estimate.
Here's the problem...
Lots of Infographics, but Very Few are Designed Well
Tools like Canva and Piktochart make quick graphics easy, and they have their place. But when a report carries your organisation’s name, template output shows its limits: locked layouts, approximate colours, and charts you cannot fully control. This workshop teaches the underlying craft in Illustrator, so your team can produce work that template tools cannot — and repair the files agencies hand over.
About this training for infographic design...
Software is Secondary, Design Thinking is Crucial
This workshop, developed by data visualization experts in Melbourne, Australia, covers the Illustrator skills that matter for infographics: artboard and grid setup, the pen and shape tools in practice, working with layers, the graph tool and when to leave it, importing charts from Excel and Power BI, typography and visual hierarchy, and exporting correctly for print, PowerPoint, and the web.
So do you...
Want to Design Infographics in Illustrator?
We know that everyone has different learning styles, which is why we offer this Illustrator training as either a live workshop (on-site at your organization) or online (Microsoft Teams or Zoom). Live sessions follow along on participants’ own machines with exercise files supplied — a current Illustrator installation is the only prerequisite.






Testimonials & client endorsements...
WHAT OUR CLIENTS SAY
The Datalabs Agency launched it’s first interactive data visualisation in 2011. Since then, we’ve kept in touch with many of our clients from all over the world. Here what some of them have to say about us.
Step-by-step processes & checklists...
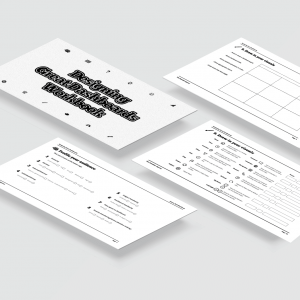
A Workbook for the Illustrator Workshop
Add to your team’s workshop experience — our Data Visualization & Storytelling Workbook is available in digital and printed versions.
The workbook consists of classroom-style instruction, theory, examples, and hands-on exercises. Order it along with our Illustrator Workshop and you will have everything you need to design great infographics. This is not your typical infographic book; it’s packed full with practical knowledge that can be applied immediately to your own projects. It doesn’t matter if you’re new to infographic design or have been creating them for years – there is something here for every skill level. By the end of this book, you can start applying these techniques in your team’s next project, creating stunning visualizations on your own.

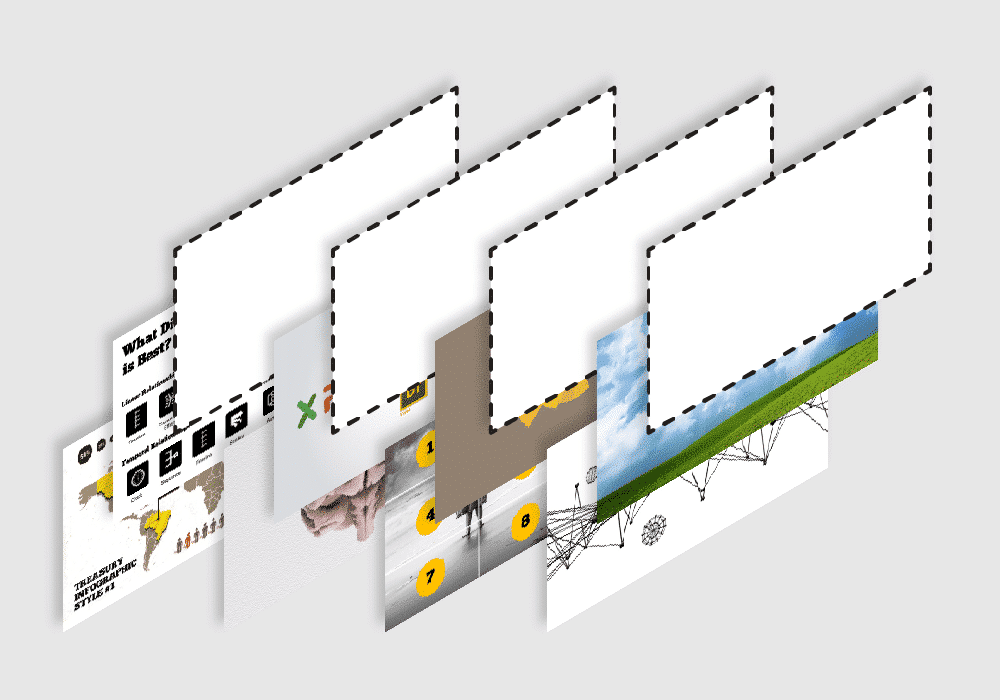
An Illustrator Workshop As Custom As You Are
You want better report design. Your team has Illustrator licences that mostly open other people’s files. Bridging that gap is a training problem: adult learners pick up Illustrator fastest when every exercise produces something they would actually publish, which is exactly how this workshop is built.
For example, we can use your organization’s brand guidelines in the Illustrator workshop — your swatches, your type, your grid. Exercises can use your data, so the infographics your team builds in training are drafts of graphics you will really publish.
Hire a professional infographic designer...
Who Teaches Our Infographic Design with Adobe Illustrator Workshop?
Otto Ottinger
Managing Director

Otto is the Datalabs Agency’s Managing Director. Having learned his data visualization skills whilst working at National Geographic, Otto now serves as the Senior Instructor and Strategist for large client engagements, holding workshops with such companies as Marriott Hotels, Al Jazeera, eBay, and the Reserve Bank of Australia.
Infographics, AI, storytelling...
Interested in a Workshop With Us?
Find out more from Otto & the Datalabs Agency. Let us know what you need below.
"*" indicates required fields
Where to buy stuff for your data?
Book a session with us or take our online course today!
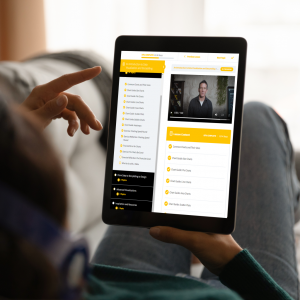


Get trained to visualize data and tell better stories.
Original price was: $129.$89Current price is: $89.


Get expert advice on data visualization from our agency's Managing Director.
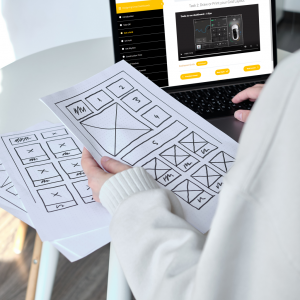

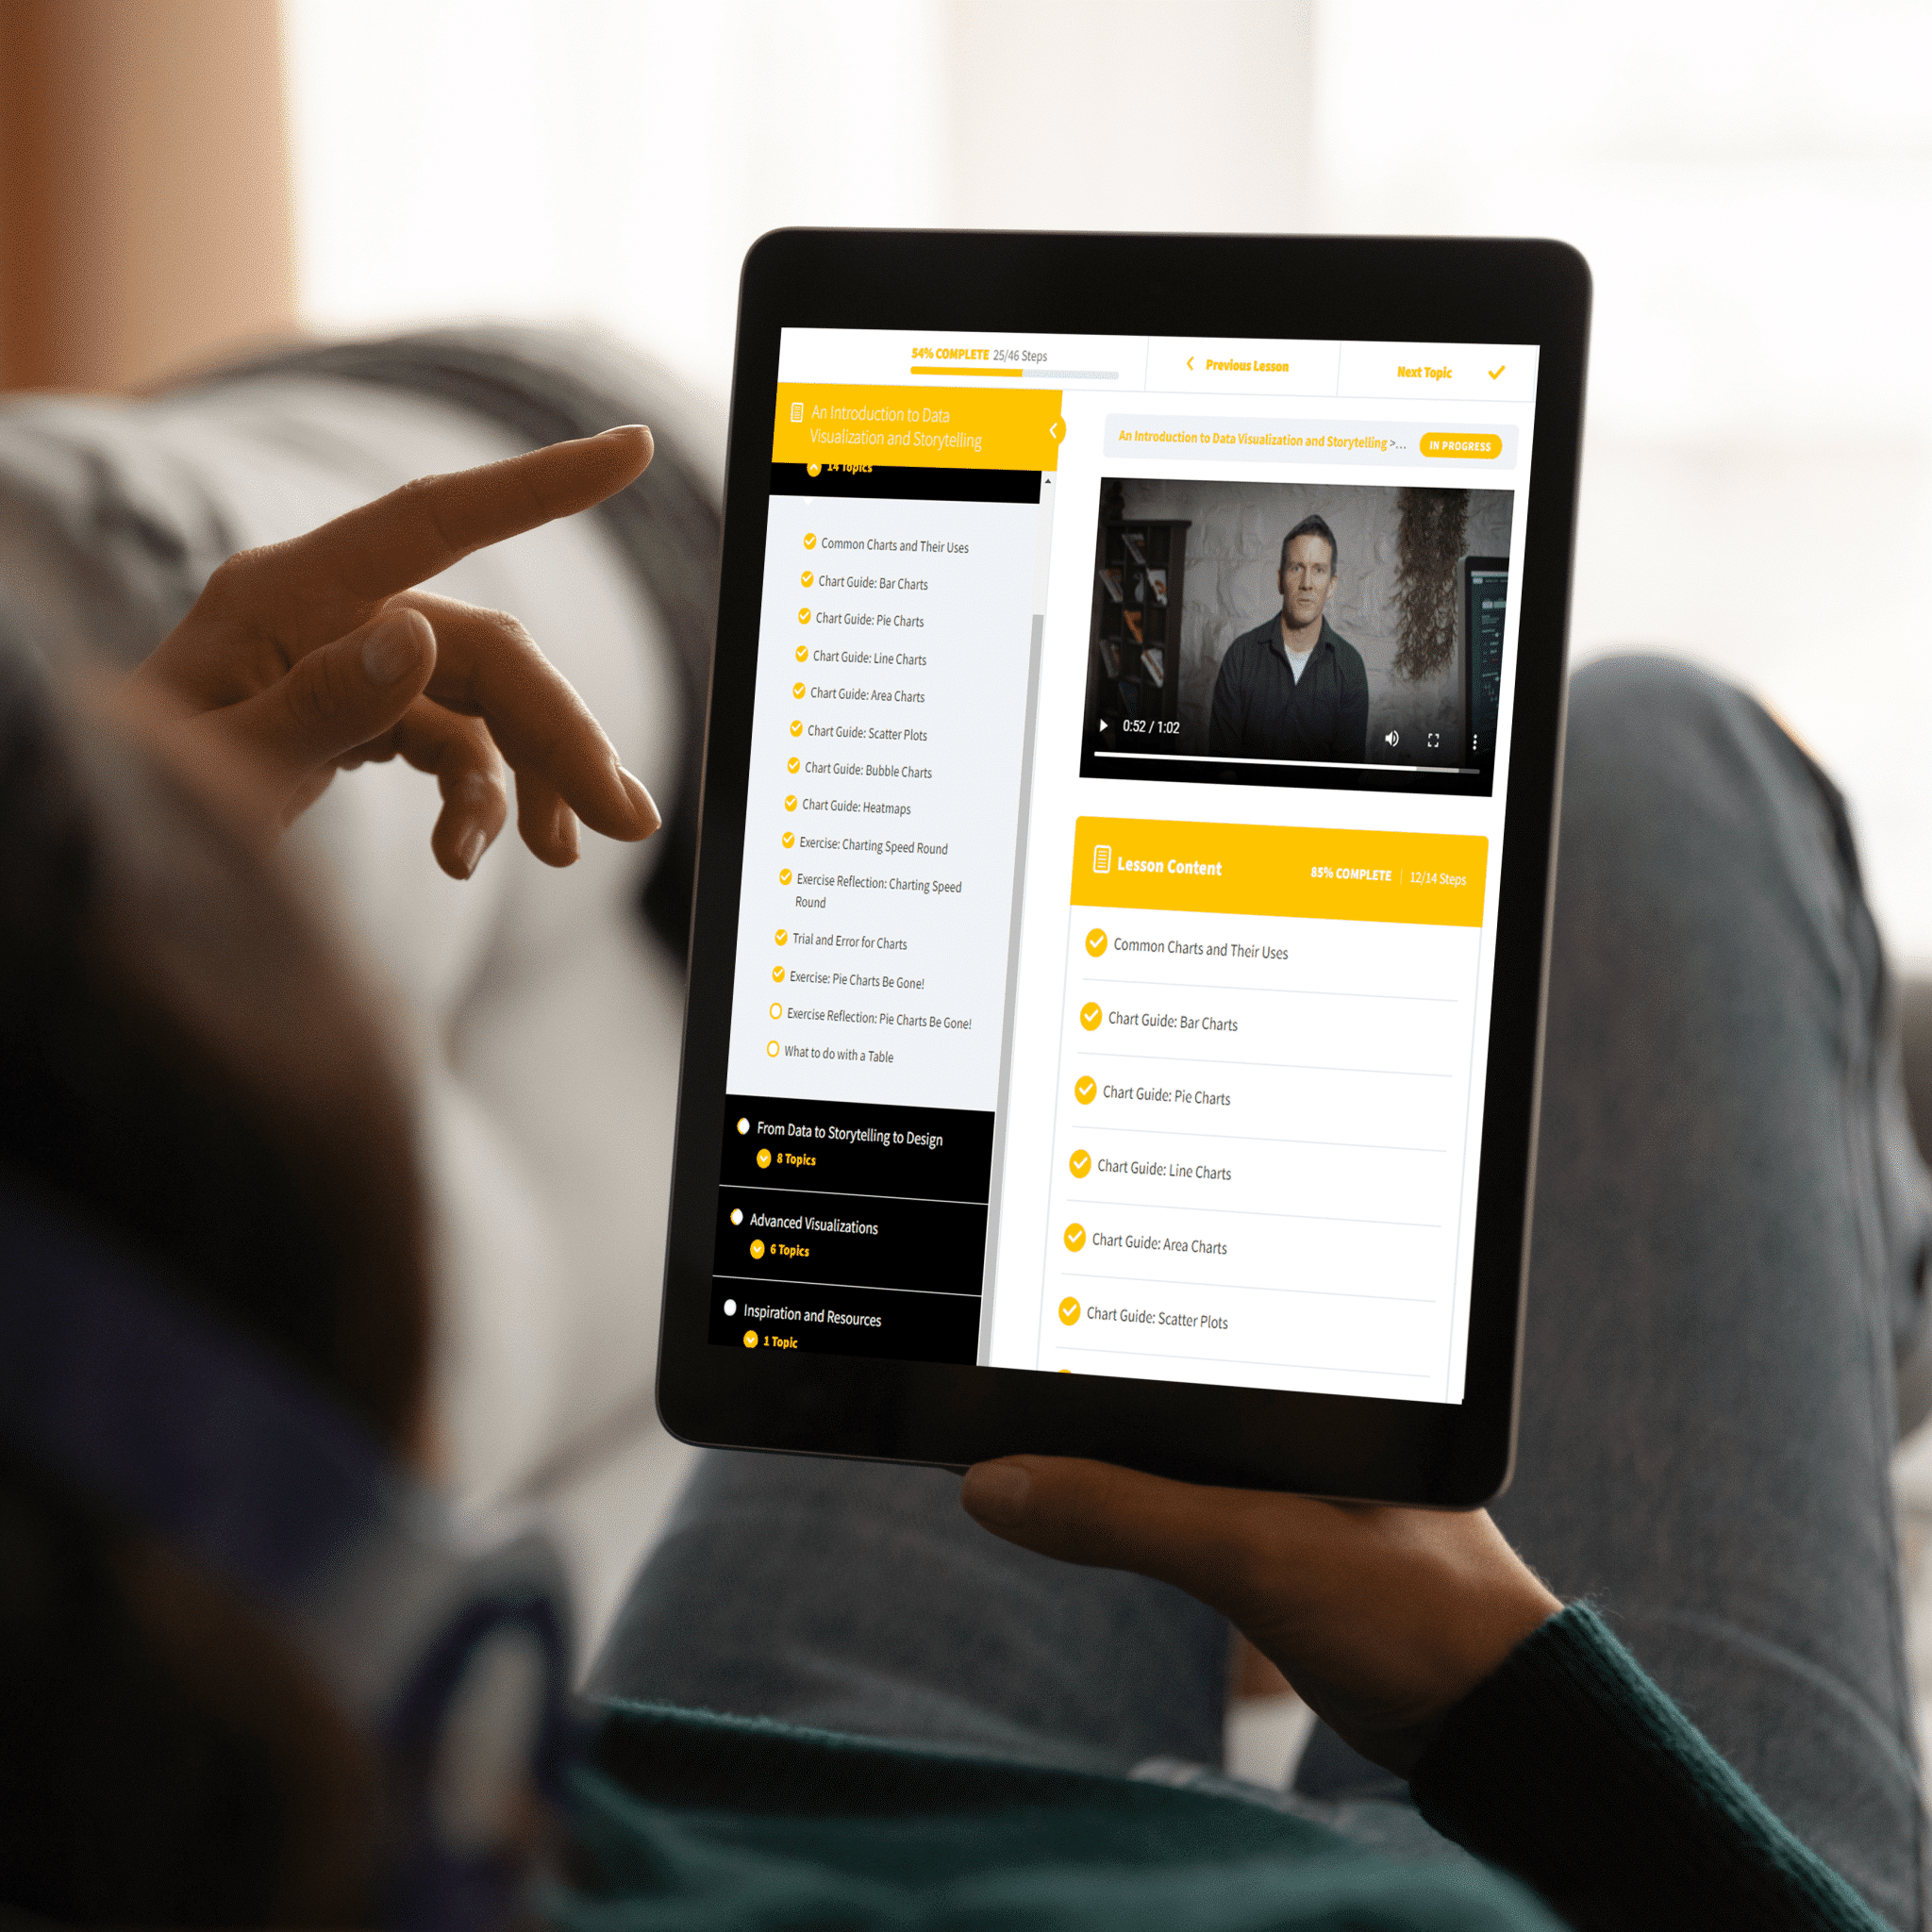

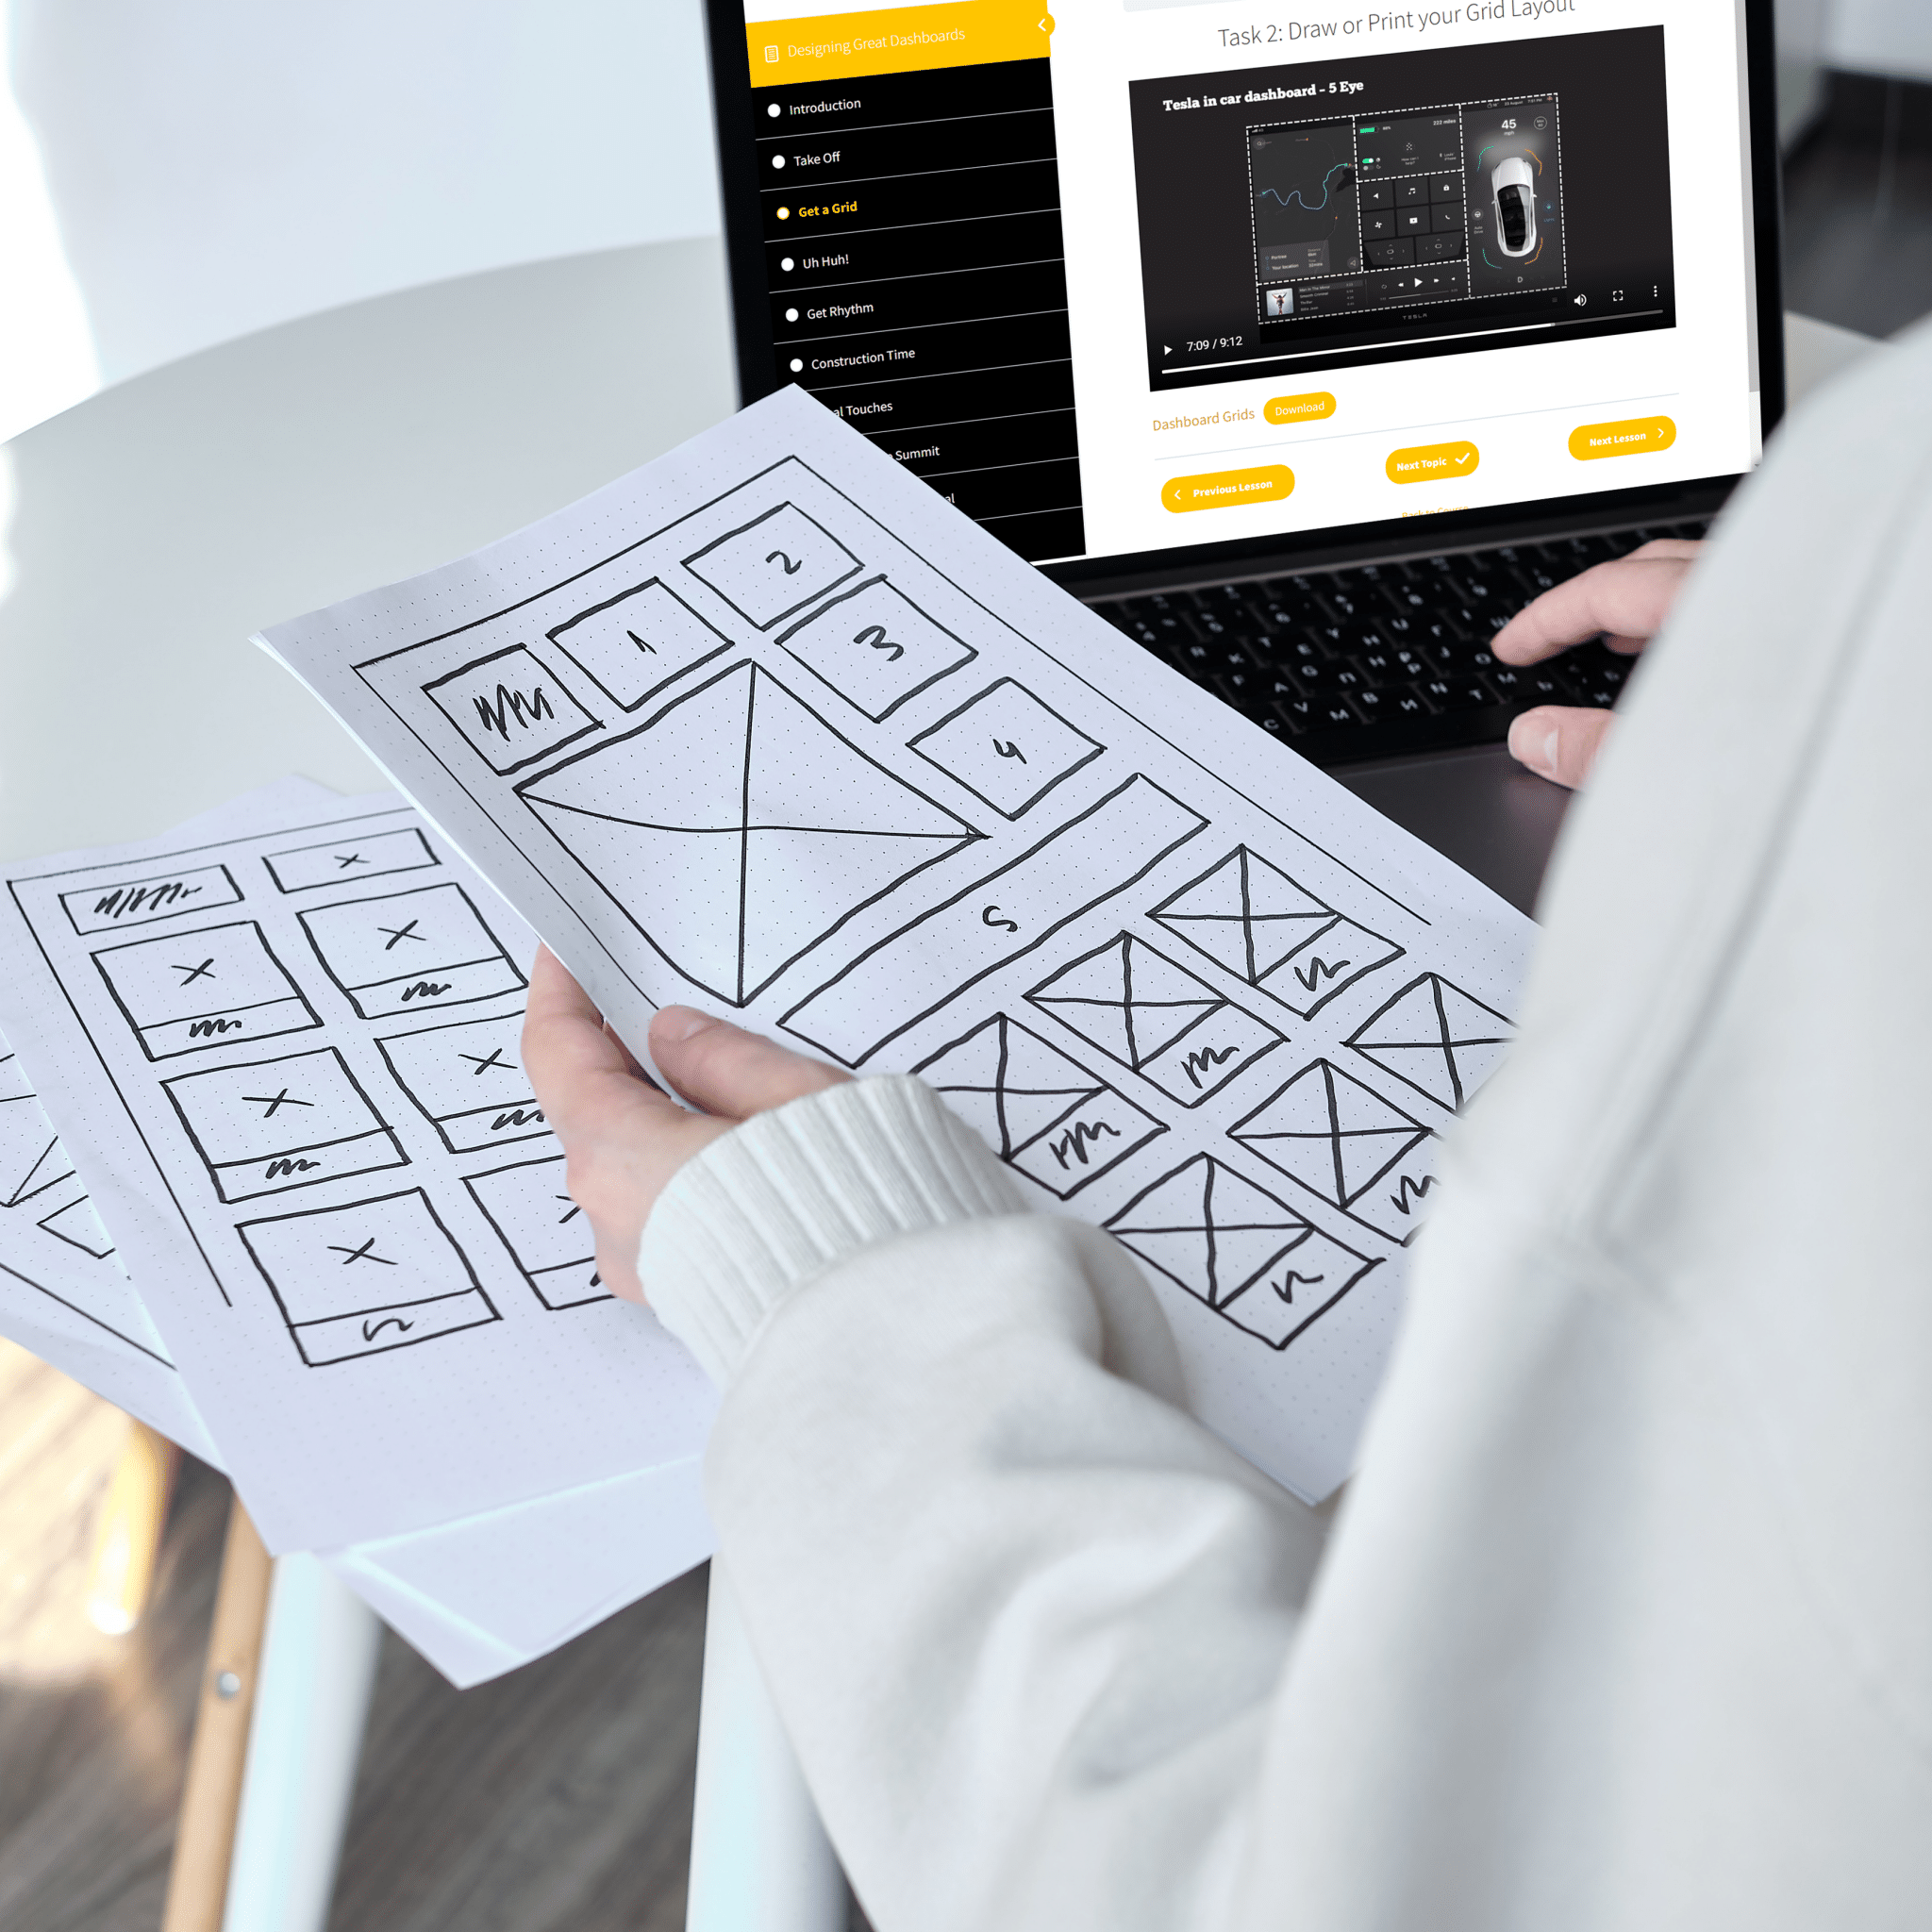
Finally, a course that shows you what you need to know.
Original price was: $129.$89Current price is: $89.