


Professional Training in Data Visualization & Storytelling for the Energy Industry
Be trained in the latest practices on design, data visualisation and storytelling tailored specifically for the energy industry. The Datalabs Agency infuses our knowledge of data visualisation challenges in the energy sector through previous client work to present you with strategies, techniques and examples. The day will provide you with the tools you can immediately apply to your work. Watch results come in through applying our process, by either finding data insights quicker leading to better business decisions, or finally having your work engaged with through presentation and storytelling techniques. Throughout the day, we touch on a series of topics to bring you up to speed through both theory and guided exercises. Get in touch with the Datalabs Agency team to learn more about how it can be even more tailored to your organisation by either adjusting the content, the exercises or the formats to specifically relate to your business.
Up-skill your team in the creative, visual communications for the energy sector. A full-day workshop that can be customized for your department or agency.
Data Visualization & Storytelling for the Energy Industry Workshop
Processes
Charts
Sources
Layouts
Exercises
Storytelling
IT ISN’T JUST A DATA VIZ WORKSHOP
Our on-site data visualization workshops come with a swag of extras. Roll-over the yellow circles below to see what you get with a Datalabs Agency workshop.

DATALABS HAVE YOU COVERED
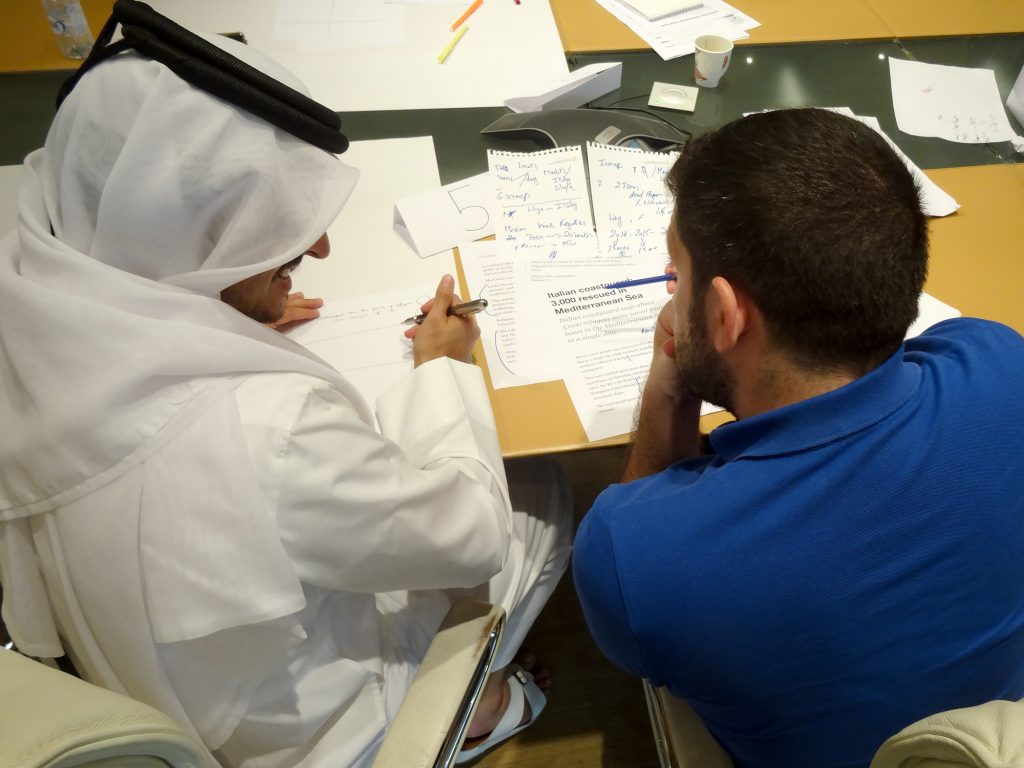
EXPERIENCED FACILITATORS
Between the facilitators, they carry over 10 years of experience in data visualization, marketing and graphic design. Yet, we still love learning and further teaching our findings to others.
ANY LOCATION
Our data visualization agency is global. We understand that it is sometimes difficult to come to us with a busy workload. Our team will happily travel to your organization.
TRACK RECORD
Each workshop the team has conducted we believe to be successful, and we’ve done a lot. We take the sessions very seriously and are pleased to know they continue to resonate with attendees.
THE DATALABS AGENCY TRAINS ENERGY ORGANIZATIONS JUST LIKE YOURS
CASE STUDIES OF SIMILAR PROJECTS

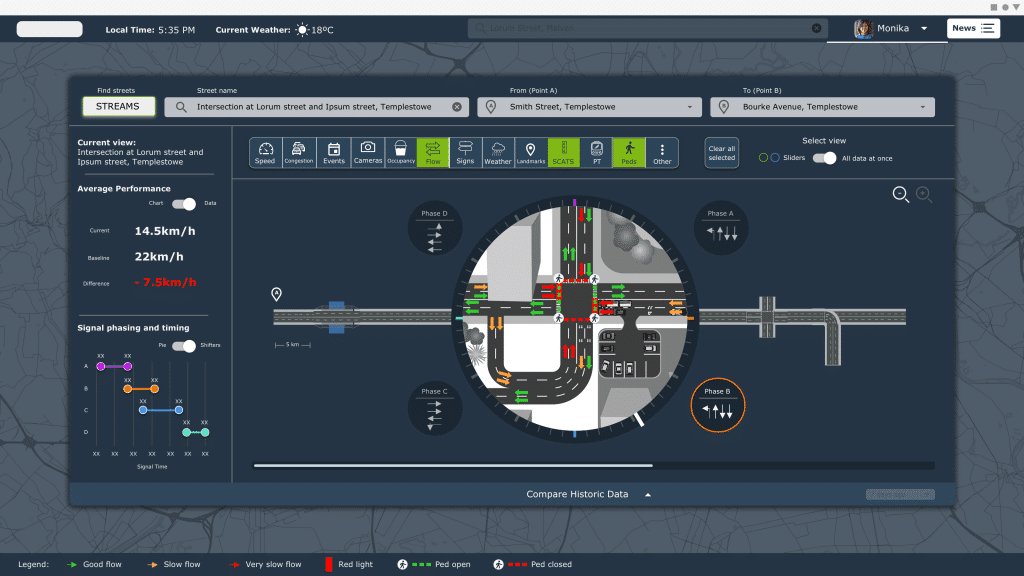
Traffic Management, IoT, and XAI Software Design
The Department of Transportation asked the Datalabs Agency to design a traffic management platform for its data. The result: a suite of interface designs showing the complexity of the road system and a way forward to optimize it at a systems level. See the future of transportation design…
INTERESTED TO KNOW MORE ABOUT OUR DATA VISUALIZATION WORKSHOPS?
Get in touch below.
"*" indicates required fields