

Get professional data visualizers working on your brand’s Tableau guidelines.
Business intelligence design...
Tableau Style Guides & Brand Guidelines
Tableau style guides and brand guidelines save a huge amount of time when styling new dashboards. They also reduce the costs of retrofitting the existing designs.
Get consistency for your business intelligence, nail down a defined process for visualizing data, and determine — once-and-for-all — a clear style for your brand in Tableau.
Our Tableau Style Guides & Brand Guidelines set the visual standards for your company’s dashboard layouts, user interface (UI) components, fonts, and charts, plus so much more…
Take a look below and then get in touch with us.
A strategic asset for any data team...
What are Tableau style guides and brand guidelines?
Tableau style guides (or brand guidelines) are a collection of a company’s data visualization standards for charts, graphs, fonts, color, interactivity, and user interface elements.
See example pages below in our Tableau style guides. Contact us to see our client case studies and to see more.


Have a look...
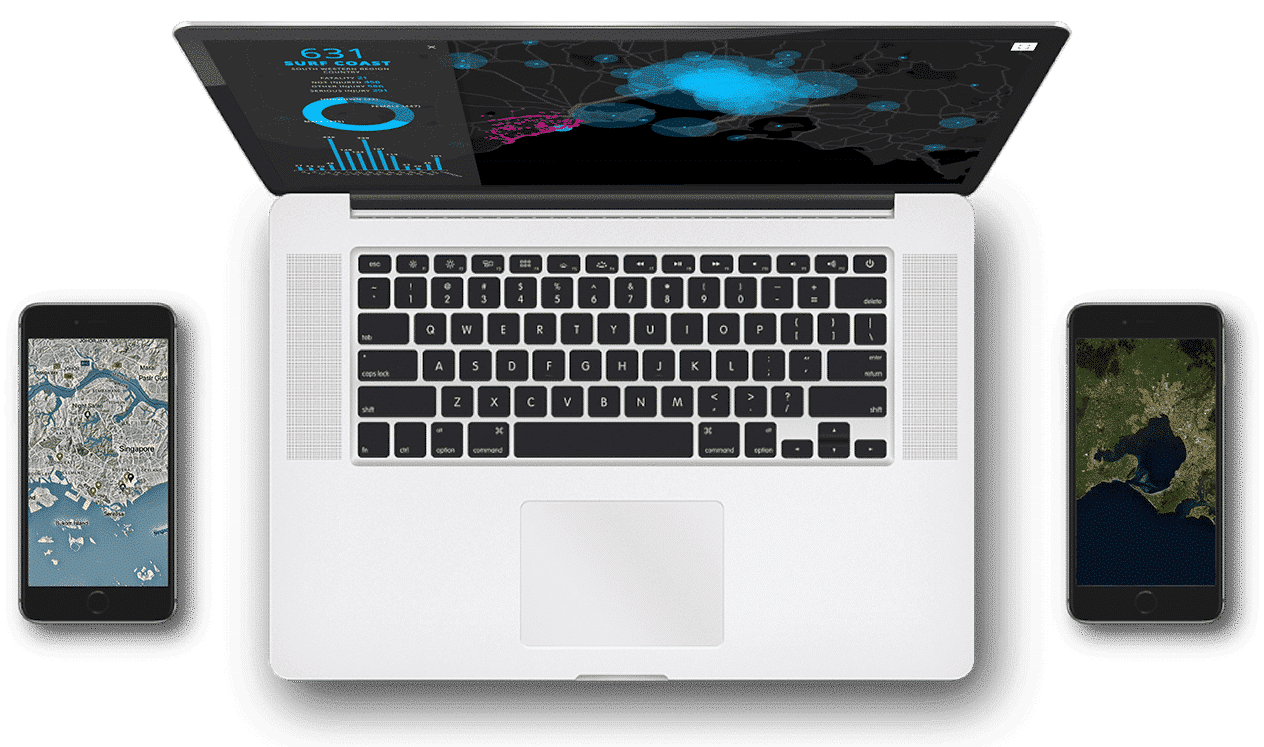
Inside a Datalabs’ Tableau Style Guide
A good question...
Why get a Tableau Style Guide?
Your analysts and data scientists are not graphic designers.
They’re not creative data visualizers, either. Then why expect them to design your company’s reports beautifully, simply, with a common user experience that is intuitively appreciated by your broad group of stakeholders? Get them a Tableau Style Guide designed with the help of your brand team and let that guide their visual aesthetic and usability ideas. A Tableau Style Guide lets them concentrate on what they do best: data analysis and insight generation.
As a data visualization agency, we see it again and again: Companies spend time and money to redesign and re-style their Tableau dashboards.
Why? Because there are no design standards.
Without a Tableau Style Guide, the lack of design standards:
1) negatively affects the user experience (UX) of your dashboard’s audience.
2) gets very expensive
3) is not a strategic use of your BI resources.
With BI guidelines in place, you and your team will:
1) save time & effort designing dashboards and workbooks.
2) move seamlessly from dashboard concept to final design.
3) design on-brand .twbx files forevermore.
Get started & get premium...
A Different Class of Power BI Style Guides
Choose the Power BI report guidelines that are right for your company.
The Datalabs Agency offers two classes of Tableau Style Guides: Standard and Business Class.
Does your company use Microsoft’s Power BI? Check out our downloadable Power BI theme and templates.
Standard Class
Our turnkey solution for Tableau
Business Class
A tailored and personalized style guide package
Tableau services we offer...
Tableau Data Visualization & Our Other Products & Services
Run a BI center of excellence with our training, design assets, and strategies.
Creating brand guidelines and style guides for Tableau isn’t the only thing the Datalabs Agency does.
We think of ourselves as a strategic data visualization agency. That’s why we offer our clients training, data visualization consultants, our design assets, and any help to get their skills for designing data to the next level.
If you are looking to secure a Tableau designer and developer, we have the best. See a recent Tableau case study here.
If you need a roadmap for everything design and communication, check out our Visual Communications Strategies service and solve your company’s Tableau challenges at the foundational level.
Contact us and ask how we can help with your Tableau styling, design, and development.
Data analysts, start shopping...
Transform Your Data Design Thinking
Train your staff to design dashboards properly, hire us, or take a course yourself.


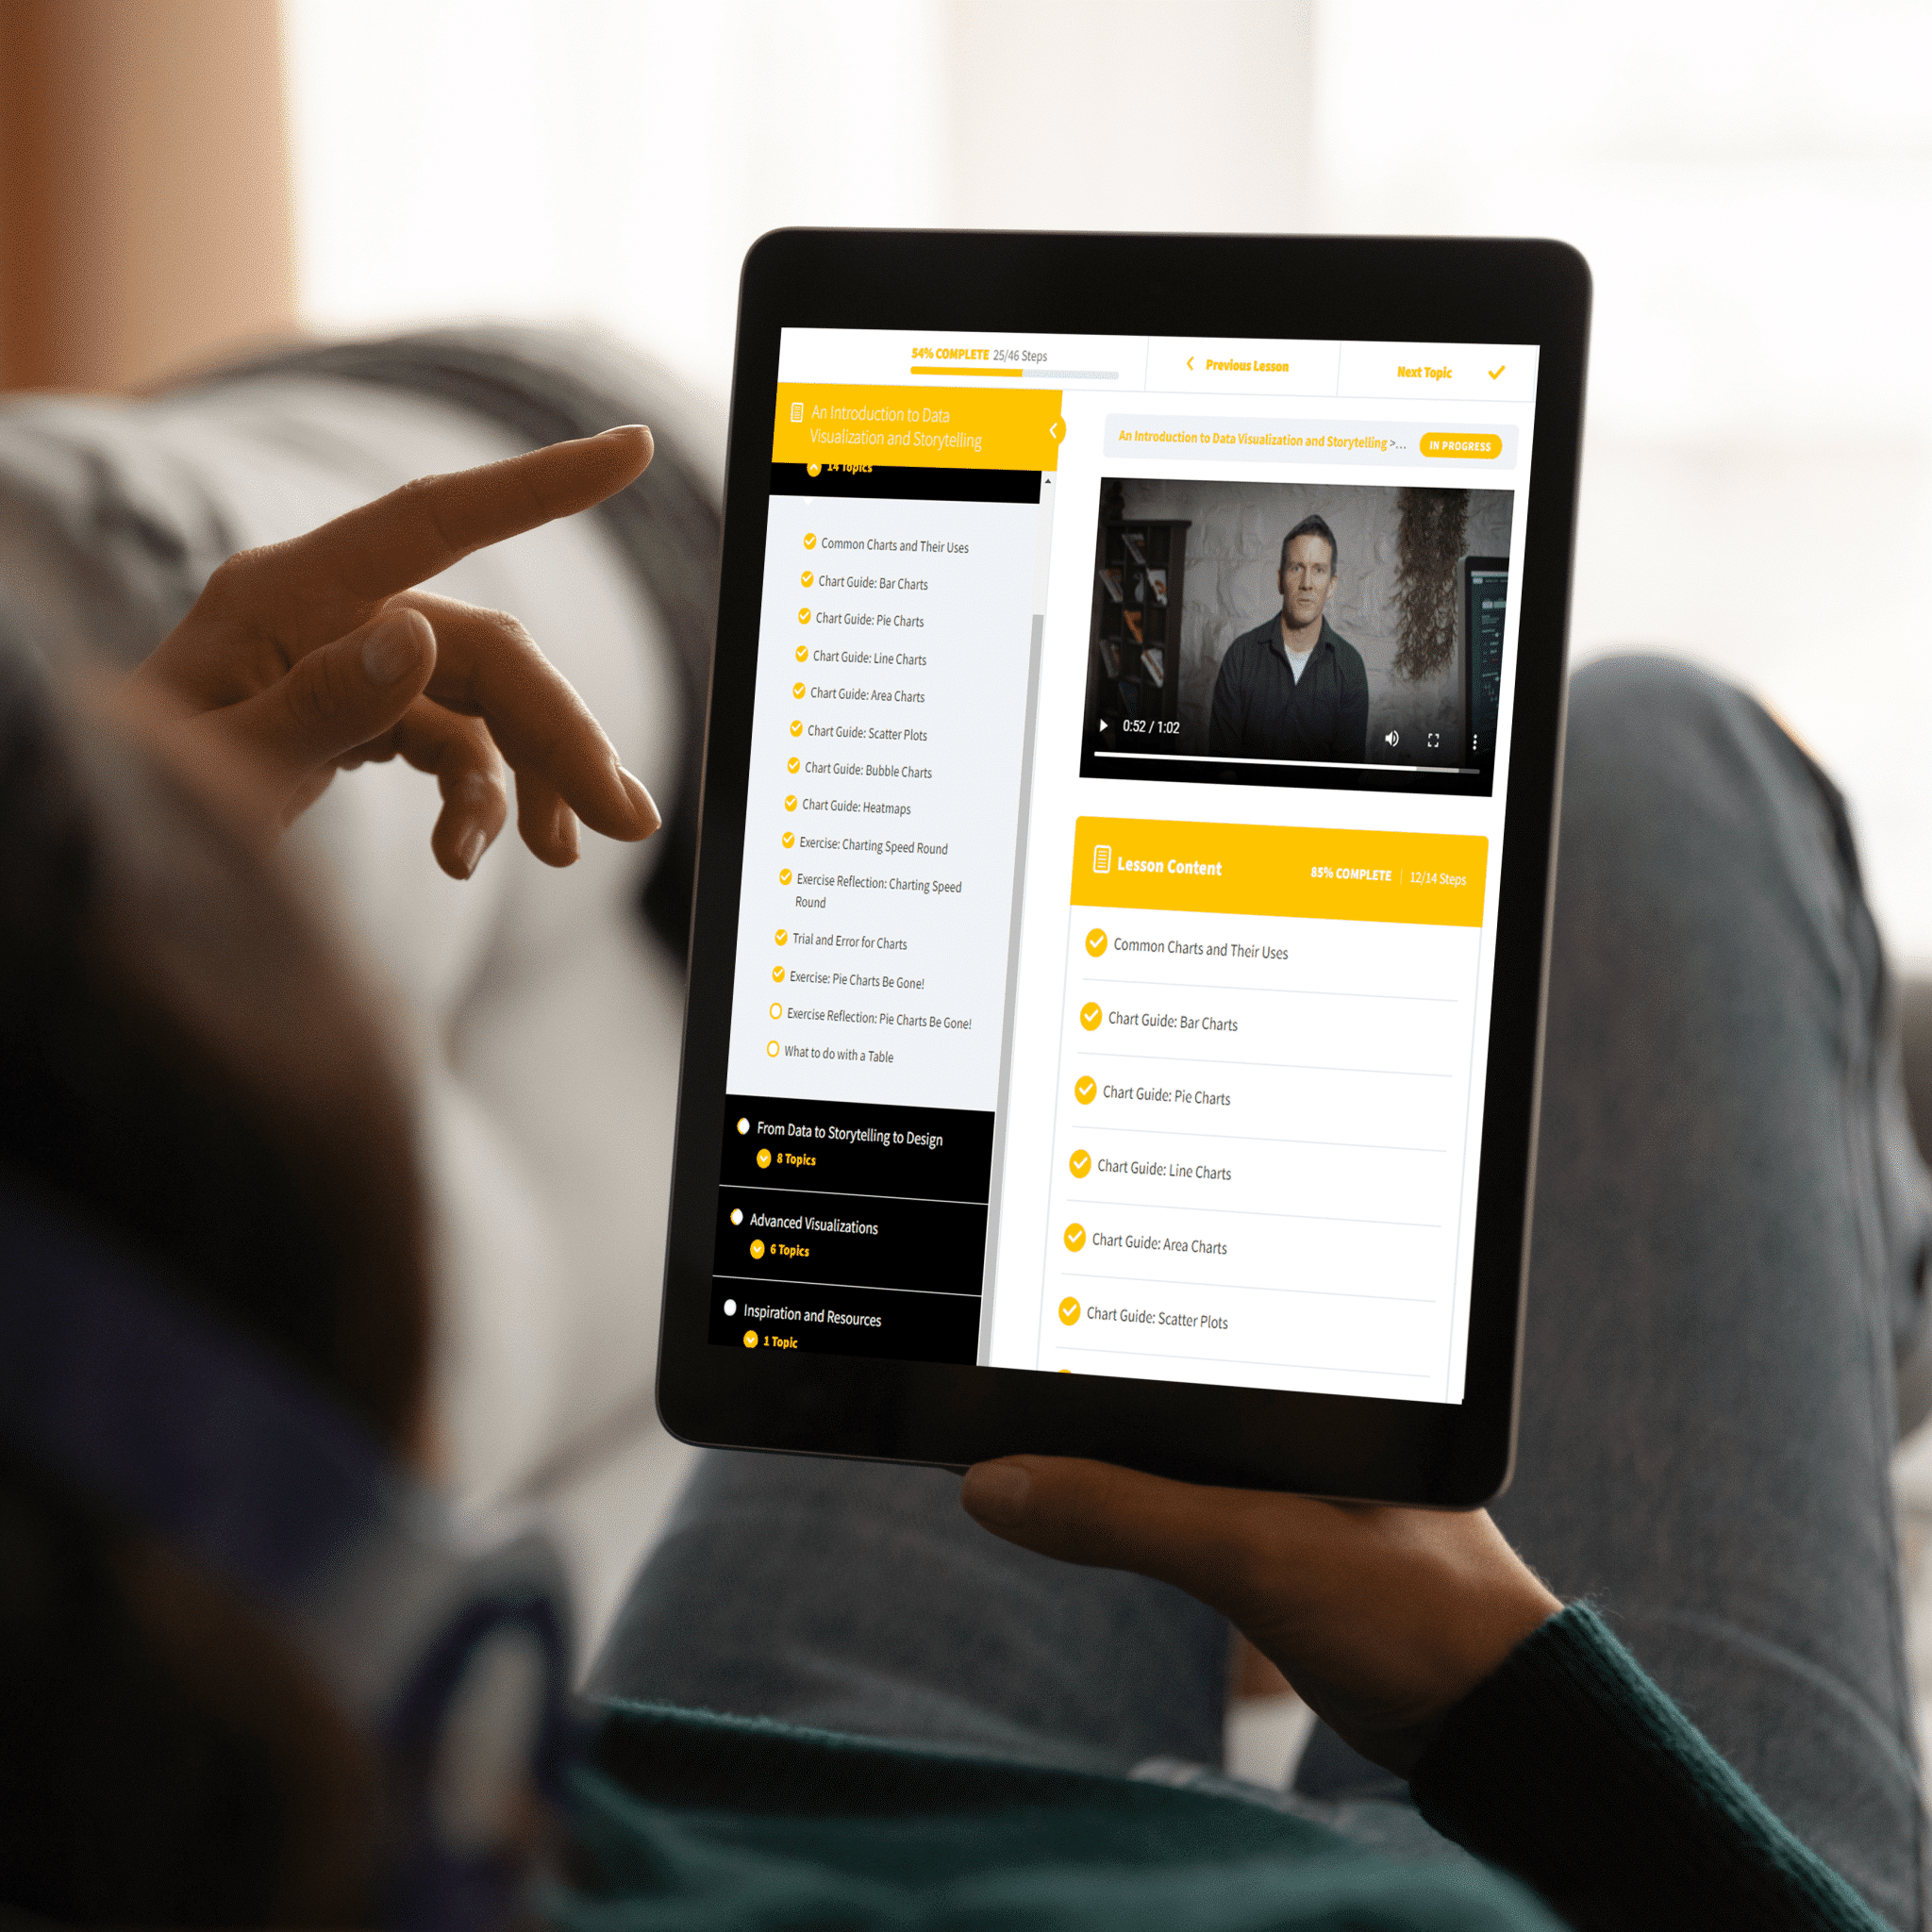
Finally, a course that shows you what you need to know.
Original price was: $129.$89Current price is: $89.


Get expert advice on data visualization from our agency's Managing Director.


Get trained to visualize data and tell better stories.
Original price was: $129.$89Current price is: $89.


Important customers with great brands
WHAT OUR CLIENTS SAY
We’re visual analysts and data visualizers, with years of experience designing on Power BI.
We’ve worked with great organizations around the world with their reporting. Here’s what they say about us.