

The team at Mercedes-Benz took the wise approach of beginning with defining a cohesive dashboard style before developing any dashboard. The Datalabs Agency took a collaborative approach injecting a lot of the Mercedes-Benz (or Daimler) brand and updating it to fit data visualization best practices. The icons, fonts and color palette all got extensive and worthwhile attention. Not to mention the choice of going to the dark side with dark backgrounds!
Mercedes-Benz
A Datalabs Agency Engagement
The Engagement

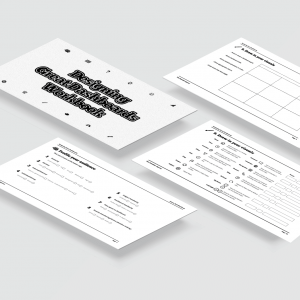
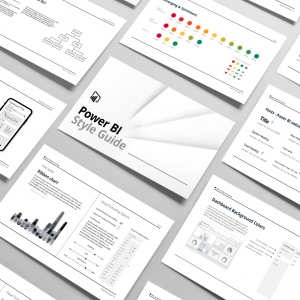
First, get the style in check
The Power BI style guide is very detailed and informative.
A Mercedes-Benz IT Developer
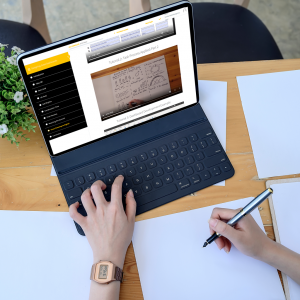
We then set off for Singapore
For these large-scale projects, Zoom doesn’t quite cut it. Perhaps it’s the scent of testosterone in the room that makes the difference. Well, we were greeted upon arrival in Singapore and shuffled into a room with executives from both Asia and the headquarters in Stuttgart, Germany. It was no slow start with all excited about either explaining how the current planning dashboards work and the possibilities of what we can do with them. You can imagine how it went. There was people in the room geeking out on Power BI updates and others, such as myself, the style elements. We needed some order. See below.


A new dashboard strategy and system
It took our Managing Director, Otto, to basically halt all conversations and mention reworking the dashboard strategy. It’s worth mentioning that this is not why they flew us over. It was supposed to be for one sales dashboard concept but ended up turning into reinventing an entire networked sales system. Which all the best projects do. Once you hear Datalabs’ ideas, it can be tough to say no. Next second, the general manager walks in the door and gets excited about onboarding us to assist in reimagine their dashboard strategy. The conversation became a lot more cohesive and collaborative with many dashboard ideas and solutions.
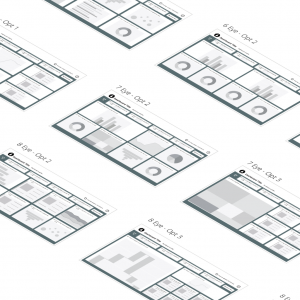
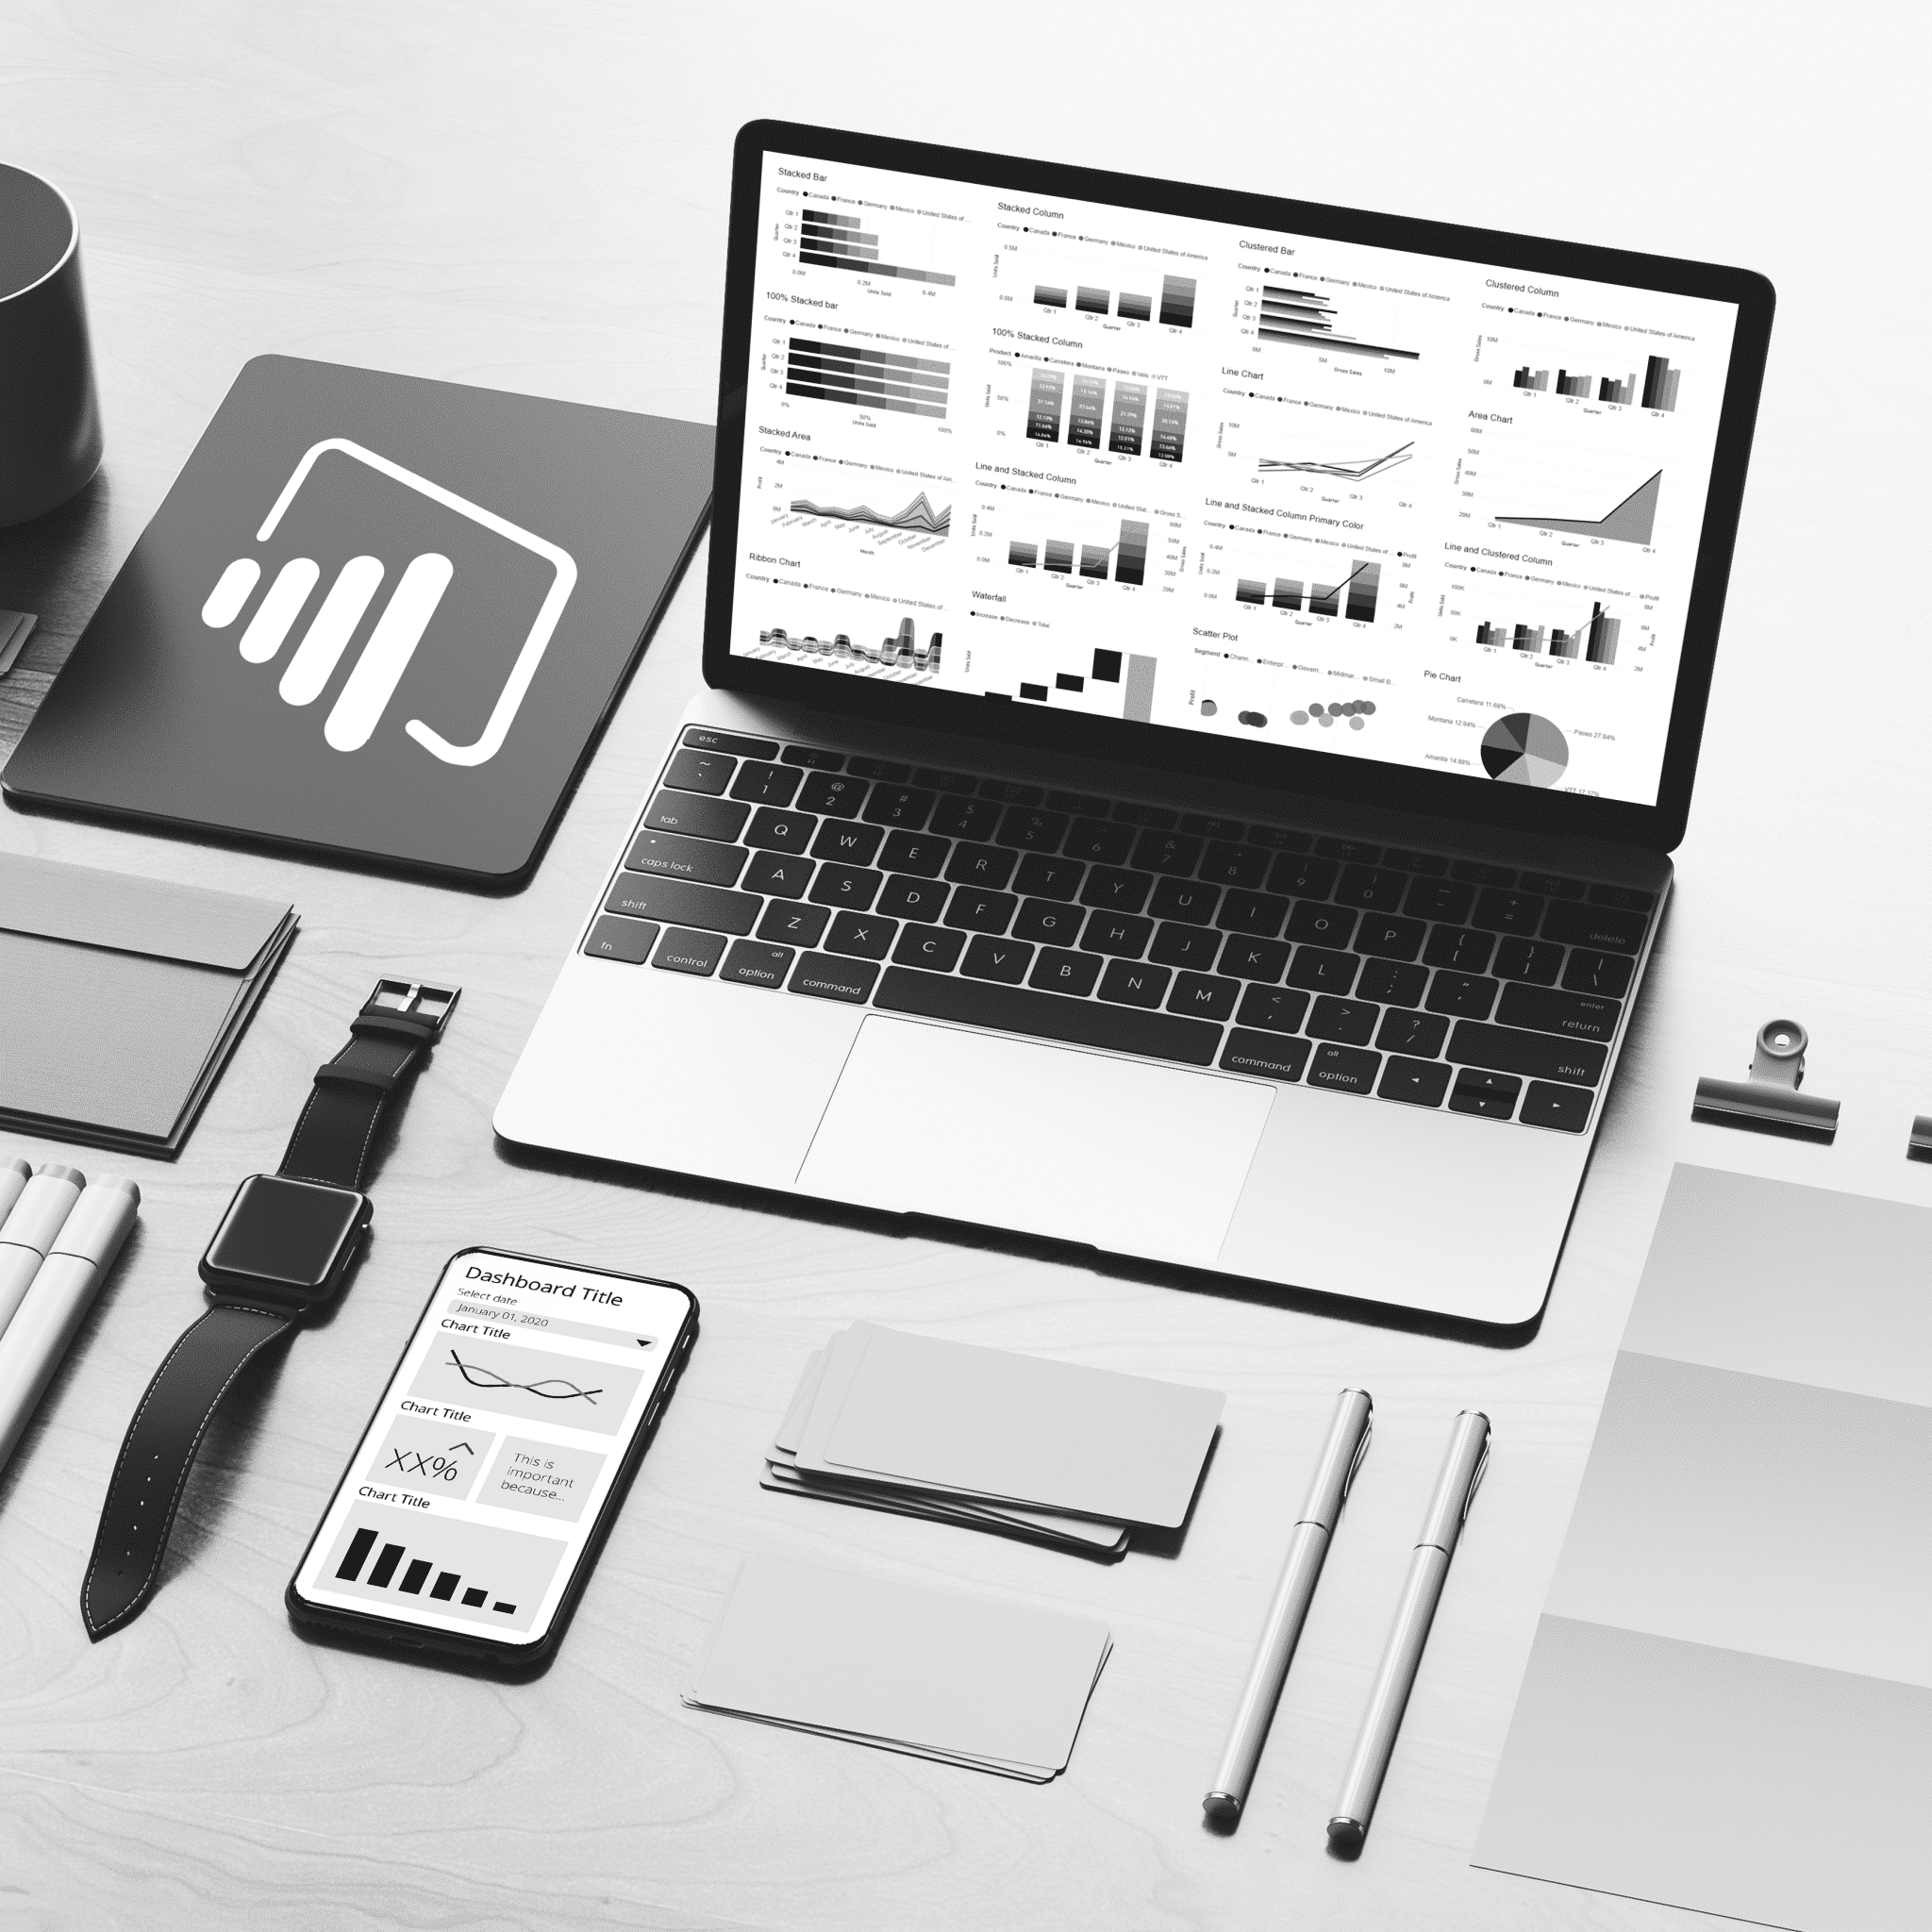
The dashboards began rolling out
If you watched the video above, the total amount of dashboards exceeded 20. This sounds like a lot but remember the gigantic business that is Mercedes-Benz and what a new strategy would involve. Everything from planning tools, and competitor comparisons to on the showroom floor sales trackers. If this sounds cool, infuse it with a brand new style and you’ve definitely got me drooling. The style elements of these dashboards included black backgrounds, a vibrant and piercing blue chart color pallette, a number of actual Benz car icons and intuitive layouts that kept breaking protocol and paying off. Talk to us particularly about my favourite, the Stock and Production dashboard.

``This looks super interesting and it is actually exactly the way we would like to go with our Dashboards.``

Andreas Wehr
Digital Business & Analytics bei Mercedes-Benz AG

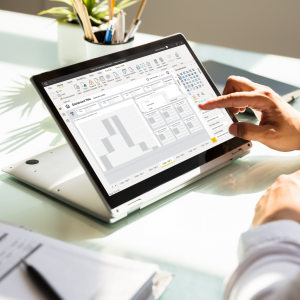
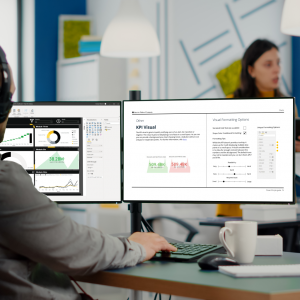
Now used around the globe
Yes, you know that Mercedes-Benz dealership down the road from your place? Well, they’ll be using our dashboard designs. The challenge here was to design a somewhat tailored experience for a global user base. We needed to design it to be very intuitive, fast loading, and set up for that specific dealership. We had a lot of key learnings from this especially around performance testing which we were constantly running diagnostics on. Apart from that, the large array of slicers needed work. We designed each dashboard to only have essential slicers and removed any unnecessary elements in the header to allow users to see the charts as quick as possible. Learning I now take into each new project.
Designs for C-suite executives
We were dealing with executives feeding directly to the highest level positions at Mercedes-Benz. So, as you can imagine, we needed fast turnaround times. This meant we needed to perfect our process. We were well on top of file management with each of the 20 dashboards having 3 versions and multiple feedback documents. Nothing was lost. We were turning around dashboards quite fast also. This is a direct pay off from nailing down the style first and being in the room for the strategy discussions. We all knew the general plan and how to build it. These dashboards are now used by C-suite executives to drive sales decisions and track according to planning KPIs. Overall a very successful engagement and one we’ve learnt a lot from and will take into future projects.

Lift your visual analytics game!
These are the same product sets as Mercedes-Benz.

Finally, a course that shows you what you need to know.
Original price was: $136.00.$69.00Current price is: $69.00.

Get the best grids, layouts, navigation, and UI components for your dashboards.
$1,206.00 – $2,121.00
An all-in-one package containing tools, guidance, and assets to design great dashboards
$496.00 – $1,145.00