


Updated October 2026
A visual case study…
Immigration, Refugees and Citizenship Canada: Data Storytelling Training
In early 2026, Immigration, Refugees and Citizenship Canada booked data storytelling training for nine staff spread across the country. They wanted two of our workshops; their calendars allowed one program. So we blended the curricula — storytelling and dashboard design in one two-day arc, briefed by the team’s own leadership before a single slide was chosen.
The engagement in one paragraph
What did the Datalabs Agency deliver for Immigration, Refugees and Citizenship Canada?
In March 2026, the Datalabs Agency delivered blended data storytelling training to Immigration, Refugees and Citizenship Canada: our Data Visualization & Storytelling and Designing Great Dashboards workshops combined into one curriculum, run as two two-hour virtual sessions for nine staff from data, functional guidance, and settlement operations teams.
The Datalabs Agency is a Melbourne-based data visualization consultancy founded in 2012 that delivers corporate training workshops (Power BI, Tableau, data storytelling), dashboard design, and BI style guides for clients including Mercedes-Benz, Adidas, and UPS.
Watch two workshops become one
Blended, briefed, delivered in two days
Two curricula and a leadership brief on the left; one program, two afternoons, and a follow-up pack on the right.
The problem behind the brief
Why blend two workshops into one?
The animation above is the program’s shape. The team’s shortlist named two workshops — Data Visualization & Storytelling and Designing Great Dashboards — and a working reality: participants from three different functions, spread across regions, who could clear two afternoons. One blended curriculum taught the group one way of working instead of running two half-courses.
Before the program was designed, the team’s assistant directors gave us a requirements session: what the group reports on, where its outputs go, and what they wanted the training to change. The blend was built against that brief — which is why a storytelling module could hand off cleanly to a dashboard one.
How the engagement ran
From enquiry to follow-up
The whole engagement, in the order it happened.
| Step | What happened |
|---|---|
| First contact | A website enquiry in late January 2026, with pricing the first question |
| Curriculum choice | The team shortlisted two workshops; we proposed one blended program |
| Kickoff call | Logistics and attendee context, early March, on the client’s Teams |
| Leadership input | A requirements session with the team’s assistant directors, 10 March |
| Day one | Two hours — Monday 23 March 2026, 1 PM Eastern |
| Day two | Two hours — Tuesday 24 March 2026, 1 PM Eastern |
| After the training | The workbook PDF and a written set of recommendations for the team |
Delivered from Melbourne into Eastern Time, on the client’s own Microsoft Teams.
From the actual deck
Two chapters from the training
Click either panel to view it full-screen — two of the chapter cards that structured the program.
The taxonomy the storytelling day is built around
Five types of visuals
The chapter card for the repeatable storytelling method
A simple process
Why this program is different
The shape of a blended training
Six things that defined the IRCC program — and define every blended workshop we build.
Delivered and left behind
What did the team keep after the training?
The workshop workbook with the dummy dataset, the session materials, and — after delivery — a written recommendations PDF: what we observed about the team’s reporting and what to change next, module by module.
A training for nine people has to outlive its four contact hours. The recommendations document turns the sessions into a to-do list the team owns — and because the leadership brief came first, the recommendations land against goals the assistant directors set themselves.
Nine people, four hours: the training has to teach one way of working the whole team can reuse on Monday.

Otto Ottinger
The principle behind the program
Questions & Answers
The IRCC training
The brief before the build
Why the leadership input session comes first
The most useful ninety minutes of the IRCC engagement happened before the training existed: a requirements session where the team’s assistant directors walked us through what the group reports on, who reads it, and the data literacy lift they wanted across three functions. Training briefs usually come from a coordinator; curriculum decisions are better made against what leadership actually wants changed.
That session set the blend. The storytelling half was weighted toward structuring a finding for a decision-making reader, because that is where the outputs go. The dashboard half was weighted toward layout and hierarchy craft the team could apply to existing reports rather than greenfield builds.
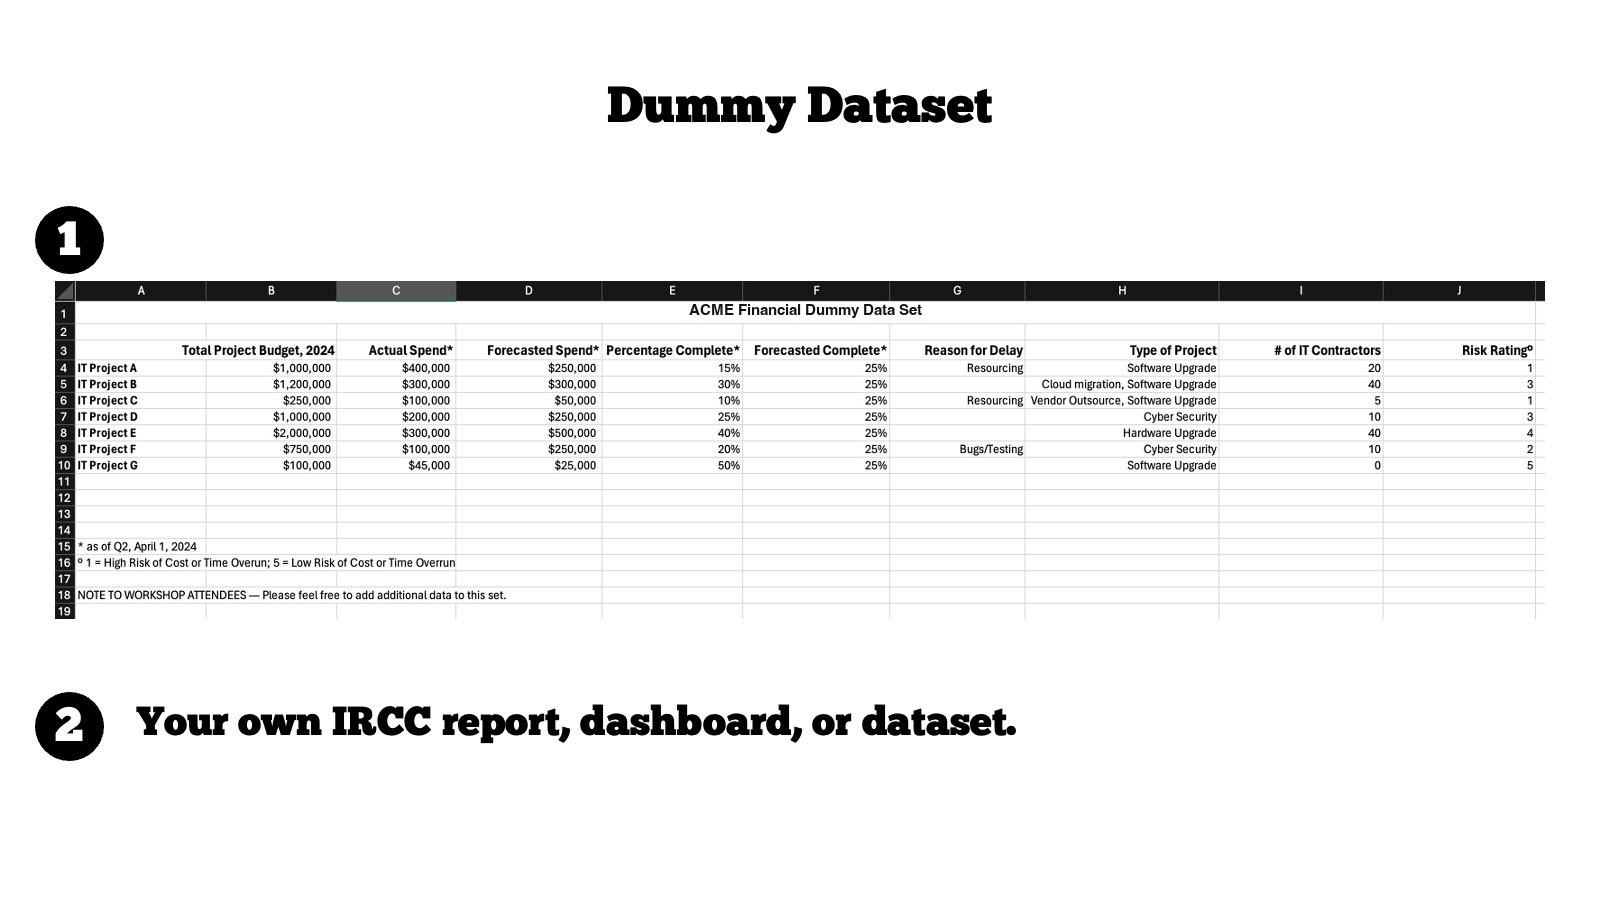
It also set the practice material. The exercises ran on a dummy dataset built to feel like reporting work — budgets, completion, risk ratings — so the group could practice without a single row of real departmental data leaving its systems. The second exercise path invited attendees to bring their own reports and dashboards, and the method transferred.
The same sequence — brief, blend, build — shapes all our training workshops. The curriculum is modular on purpose; the brief decides the mix.


Four hours, carefully spent…
The economics of a two-afternoon program
Government training lives inside hard constraints: distributed teams, full calendars, and procurement that rewards clear scope. The IRCC program’s shape — two two-hour sessions on consecutive days at 1 PM Eastern — came from those constraints, and it is a shape we now recommend by default for public-sector groups.
Two hours is roughly the ceiling of productive attention on a video call, and the overnight gap does real work: day one’s storytelling method gets a night to settle before day two builds dashboards on top of it. A single-day marathon of the same content tests worse every time we compare.
Delivery ran on the client’s own Microsoft Teams, with the coordinator sending the invites — attendees joined a meeting that looked like every other meeting on their calendar, with none of the external-platform friction that quietly eats the first fifteen minutes of a session.
And the follow-up pack — workbook plus a written recommendations PDF — means the engagement’s last artifact is a plan, which suits how government teams fund next steps. The workshop pricing page shows how the per-person economics work for a group of nine.
The Data Design Firm for AI & Visualization
The Datalabs Agency
Templates, guides, grids, icons…
Creative Design Assets »
Learn visualization and storytelling skills…
« Beautiful Courses in Data Design
Some of the notable brands Otto has worked with…
Otto Ottinger’s Clients of Note








Professional & Thought-provoking
Looking for a speaker for your event?
"*" indicates required fields