Hydro Tasmania is Australia’s leading clean and renewable energy producer. Hydro manage a multitude of assets which include turbines generating the power located at power stations all across the island. These turbines at times need to be switched off for maintenance. With one turbine switched off, another needs to be turned on to keep Australia’s lights on. With so many assets across Tasmania being switched on and off, it makes the planning of timing, people managing, and informing all stakeholders quite a difficult task.
Hydro Tasmania reached out to the Datalabs Agency to design a system to view the whole picture at once and better inform the business of asset outages. This ‘whole picture’ would communicate the outages by location, resource and time. We set to work by organising a co-design/information gathering session in the Hydro headquarters in the historic capital city of Hobart.
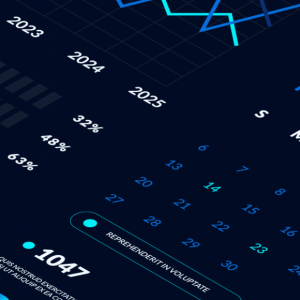
It became apparent to us that an interactive portal would be most suitable in housing all key and relevant information. An obvious and intuitive navigation solution was a map of the island with all power stations quickly locatable. From there an interactive Gantt chart visualisation was designed where assets with outages alongside assets without were compared along a timeline, (to put it simply). Further functionality included personal logins with notifications sent to stakeholders informing them of relevant and pressing information.
This project was deemed successful after the concept was pitched and approved by key executives. Who further, permitted the concept of a control room with large monitors allowing 360 degree visibility supported by the latest in interactive technology. For that, expect a case study in the not too distant future.


