


Updated October 2026
A visual case study…
Environment and Climate Change Canada: Data Visualization Training
In 2024, a Canadian Wildlife Service team at Environment and Climate Change Canada went looking for data visualization training that fit the way scientists actually work. We built them a customized workshop — ten modules across two online afternoons — taught on the department’s own slides, maps, and data.
The engagement in one paragraph
What did the Datalabs Agency deliver for Environment and Climate Change Canada?
In June 2024, the Datalabs Agency delivered customized data visualization training to a Canadian Wildlife Service team at Environment and Climate Change Canada: our Visual Storytelling for Government workshop blended with modules from Creative Data Presentations with PowerPoint, run as two two-hour online sessions with a workbook and a 93-slide reference pack the team kept.
The Datalabs Agency is a Melbourne-based data visualization consultancy founded in 2012 that delivers corporate training workshops (Power BI, Tableau, data storytelling), dashboard design, and BI style guides for clients including Mercedes-Benz, Adidas, and UPS.
Watch two curricula become one workshop
Built to order, delivered in two sittings
Three ingredients on the left — two Datalabs curricula and the department’s own material — blended into one program on the right.
The problem behind the brief
Why does a science team need data storytelling training?
The animation above is the workshop’s shape. Behind it sits a familiar gap: wildlife scientists produce rigorous evidence — assessments, surveys, policy inputs — and then present it through default PowerPoint. The team wanted its findings to land with decision-makers as clearly as they read in the field data.
The brief came with a constraint we like: make it theirs. So the training ran on Environment and Climate Change Canada’s own presentation template, used the department’s published maps as teaching material, and worked through slide problems the team actually faces — a curriculum assembled for six people, with every seat hands-on.
How the engagement ran
From enquiry to follow-up
The whole engagement, in the order it happened.
| Step | What happened |
|---|---|
| First contact | A website enquiry from the Canadian Wildlife Service team, February 2024 |
| Scheduling | Dates and a quote settled for a six-person group |
| Pre-workshop call | Attendee insights and logistics, the week before the training |
| Session one | Two hours online — 11 June 2024, 1–3 PM Eastern |
| Session two | Two hours online — 12 June 2024, 1–3 PM Eastern |
| After the workshop | The workbook, the 93-slide key-slides pack, and follow-up material for the team |
Delivered from Melbourne into Canadian time zones.
From the actual deck
Two slides from the workshop
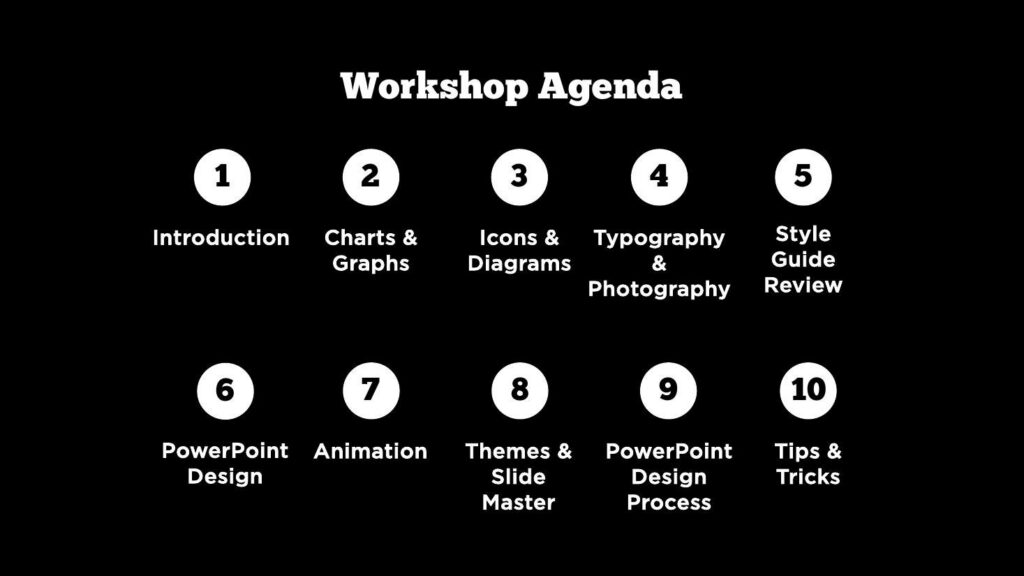
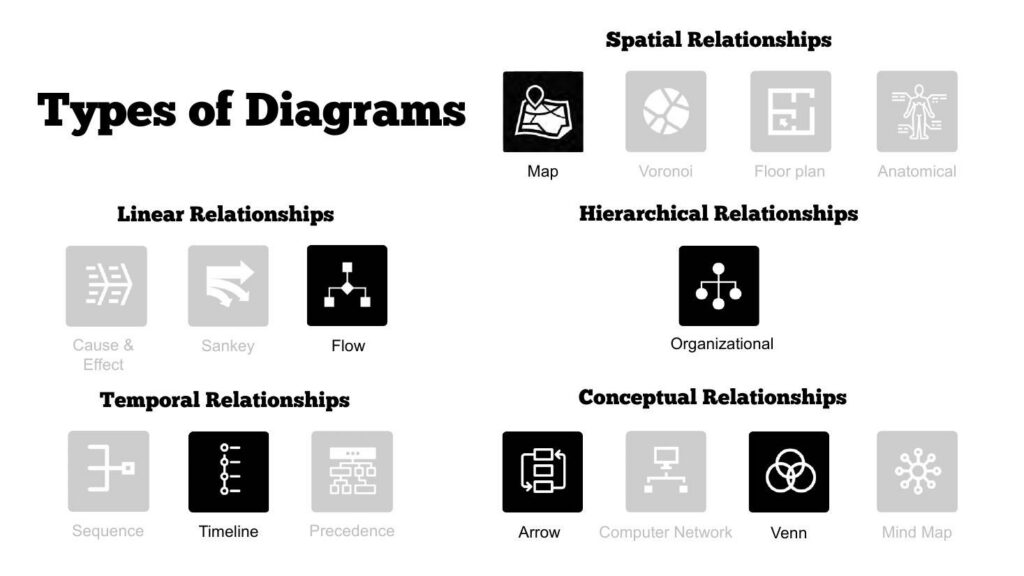
Click either panel to view it full-screen — the ten-module agenda, and one of the teaching slides on choosing the right diagram.
Ten modules across two afternoons — the menu the team worked through
The agenda
A teaching slide from the Icons & Diagrams module
Types of diagrams
Why this workshop is different
The shape of a customized training
Six things that defined the ECCC workshop — and define every custom workshop we build.
Delivered and left behind
What did the team keep after the training?
A workbook for the exercises, the full 93-slide key-slides pack covering all ten modules, and follow-up material sent after the sessions — so the workshop’s content outlives the two afternoons it ran in.
Training a six-person team is an exercise in leverage: the materials have to keep teaching after we log off. The key-slides pack doubles as a reference manual — when someone builds a deck in November, the module on slide masters is still there, in the department’s context, ready to reuse.
Scientists already have the evidence. Training gives them a repeatable way to make it legible.

Otto Ottinger
The principle behind the workshop
Questions & Answers
The ECCC workshop
Customization, concretely
What a customized workshop actually means
Customized training is an easy claim and a hard deliverable, so here is what it meant for ECCC, concretely. First, the template: every demonstration ran inside the department’s own slide master — the Canada wordmark, the bilingual title conventions, the real constraints the team publishes under. Teaching PowerPoint craft in a generic theme and leaving the translation to the attendees is where most training leaks value.
Second, the material: the exercises used the department’s published wildlife maps and the team’s own slides as raw material. A module on diagrams lands differently when the diagram being rebuilt is one your directorate actually shows.
Third, the module mix: the enquiry named a storytelling need, and the conversation surfaced a presentation-craft need alongside it. So the program blended our government storytelling core with modules from Creative Data Presentations with PowerPoint — ten modules chosen for this team, in an order that builds.
The same blending is available to any group: our training workshops share a modular spine, and the quote stays the same whichever modules you pick.


Melbourne to Gatineau…
Running government data visualization training across the planet
The ECCC workshop ran from Melbourne into Eastern Time — a fifteen-hour offset — and the logistics are part of the case study. Afternoon sessions in Ottawa are early mornings in Australia, which suits a trainer better than the reverse, and the two-session format meant no single marathon call for either side.
Government delivery has its own texture. Sessions ran on the department’s own conferencing setup, attachments and materials moved under the client’s security expectations, and the pre-workshop call a week out covered attendees, logistics, and the material the team wanted woven in. By the first session, the customization was already done.
Small groups change the economics of attention. With six attendees, every exercise gets reviewed, every question gets airtime, and the trainer can adapt module emphasis live — the style guide review ran against the department’s actual template because the group wanted it to.
We have since run the same shape — enquiry, customization, two online afternoons — for government teams on three continents. The workshop pricing page shows how the per-person economics work for groups this size.
The Data Design Firm for AI & Visualization
The Datalabs Agency
Templates, guides, grids, icons…
Creative Design Assets »
Learn visualization and storytelling skills…
« Beautiful Courses in Data Design
Some of the notable brands Otto has worked with…
Otto Ottinger’s Clients of Note








Professional & Thought-provoking
Looking for a speaker for your event?
"*" indicates required fields