أساسيات تصور البيانات لدينا
كتاب تمهيدي لتصور البيانات
لنلق نظرة على بعض أساسيات تصور البيانات. في عصر اليوم المتقدم تقنيا ، نحن غارقون في البيانات كل يوم – ليست كلها مفيدة بالضرورة. إن الاحتفاظ بالبيانات هو كنز ، ولكن ما هو الكنز إذا كنت لا تستطيع الاستثمار فيه؟
تهدف عملية تصور البيانات إلى فهم المعلومات ، والتي بدورها يمكن استخدامها لتشكيل وتوجيه القرارات المستقبلية. قد يكون تشكيل هذه المعلومات في شيء مفهوم ومقروء أمرا صعبا ، مما يتطلب الدقة والتحليل الذي يأتي مع الخبرة والدراية العامة.
هل تريد الغوص بعمق في عالم البيانات – من أين تبدأ؟ دعونا نقسمها إلى أبسط عناصرها ، أليس كذلك؟
ما هي الأنواع الأساسية للرسوم البيانية وكيف يمكنني استخدامها؟
تتكون لوحة القيادة من مخططات من أنواع مختلفة ، ولكل منها حالات الاستخدام الخاصة بها. فكر في مخطط مثل اللوحة القماشية – يمكن للمخطط الصحيح تحسين بياناتك ، اعتمادا على نوع الرسالة التي تريد نقلها. فيما يلي إرشادات عامة لأنواع المخططات المختلفة وأفضل ممارساتها.
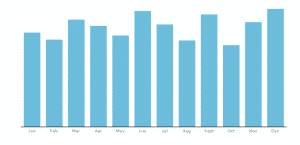
Column Chart
Used to show comparison over time or amongst different items. It is simple, succinct, and to the point. Use consistent colors throughout the columns to avoid confusing readers, utilizing accent colors to highlight meaningful data points. To reflect the values appropriately, start the y-axis at 0.
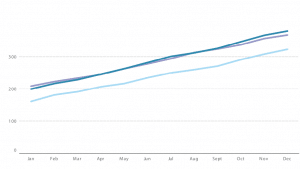
Line Graph
A line graph reveals continuous data, showing trends and progress over time. Multiple data sets can be shown through different plots, differentiated through contrasting coloured lines. Avoid having too many data sets/lines as it can be confusing to read.
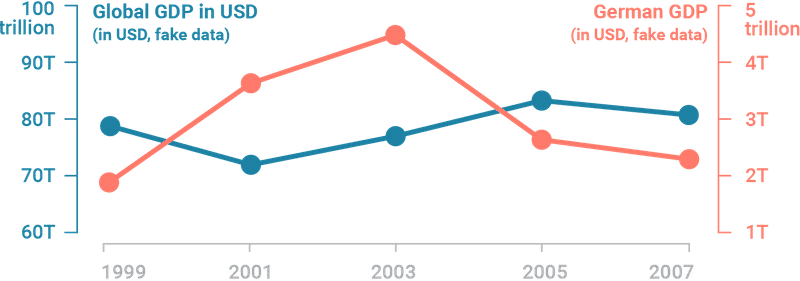
Dual-axis Chart
Think of dual-axis chart as the love-child of line and column charts. This type of chart allows you to plot based on two y-axes figures and a single x-axis, meaning you can visualize a correlation – or lack thereof – between three data sets. For best practice, use contrasting colors and different graphic styles between data sets to distinctly differentiate them.
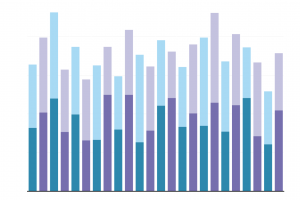
Stacked Bar Chart
A cousin of the column chart, stacked bar charts are like a column chart, with the addition of showing the variables that make up a column. This illustrates a part-to-whole relationship for each data sets over time. Use contrasting colours for each variable for clarity.
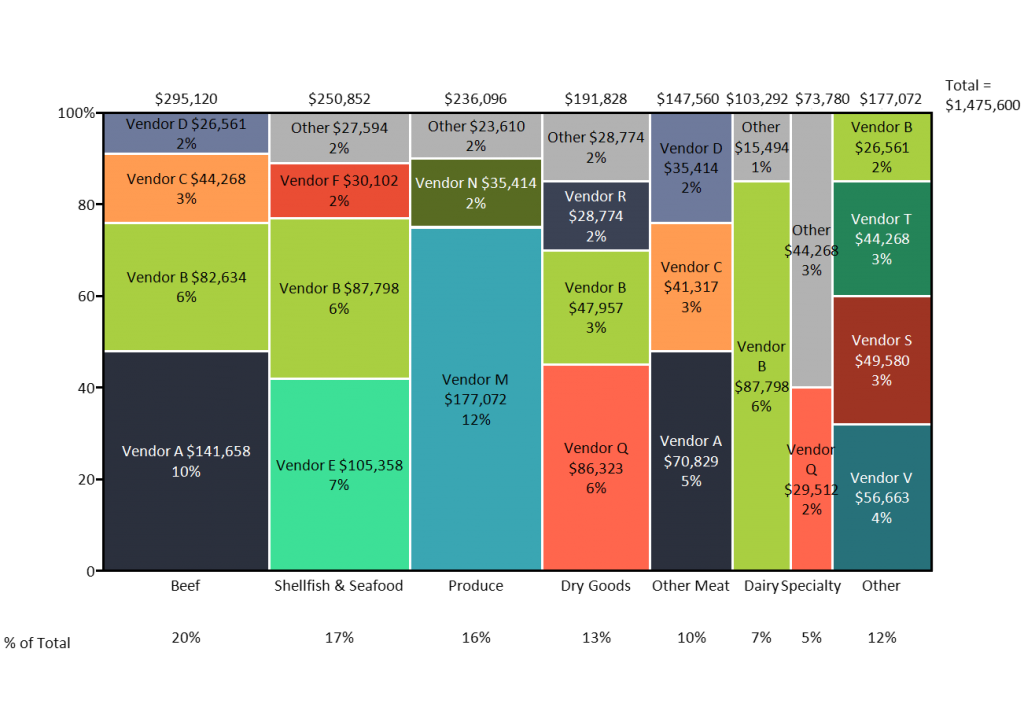
Mekko Chart
A mekko chart, also known as Marimekko chart, is similar to a stacked bar, except the x-axis can capture numerous dimensions, rather than just a progression of time. Each bar can contain multiple composite values. For best practice, use a color gradient for each stacked bar to represent its correlation to one another, and organize the placement of sets in such a way to expose a relevant trend.
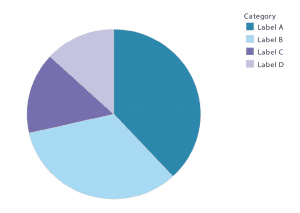
Pie Chart
Who’s never heard of a pie chart? Pie charts are best to show how categories represent part of a whole – a 100%. For best practice, ensure that all slices adds up to 100% and segment slices according to their size. Avoid illustrating too many categories to ensure differentiation between each slice.
ما هي لوحة القيادة؟
باختصار ، تعرض لوحة المعلومات المعلومات المجمعة بطريقة مرئية وسهلة الهضم. هناك أنواع أساسية من لوحات المعلومات:
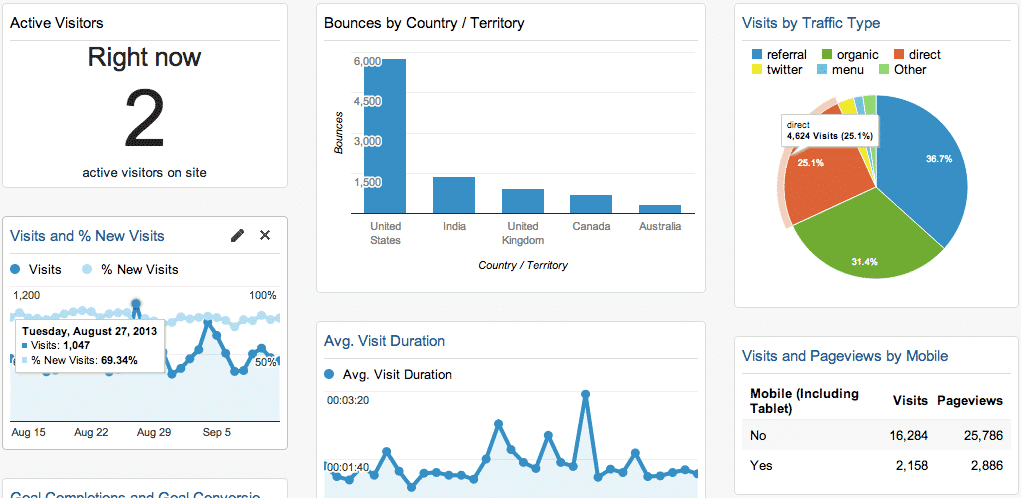
Operational Dashboards
This type of dashboard is used to monitor a business process and track its performance against a set Key Performance Indicators (KPIs). Its data changes frequently, sometimes on a minute-by-minute basis, and is designed to be viewed multiple times a day. An example is Google Analytics that tracks website traffic.
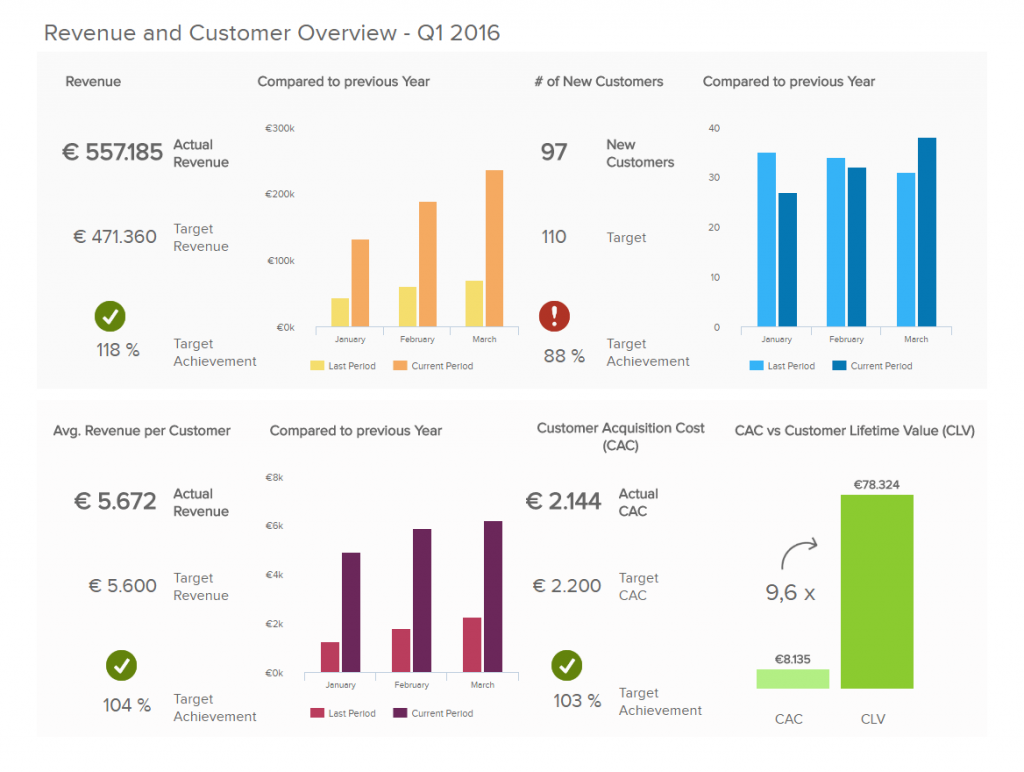
Strategic Dashboards
Strategic dashboards are often used by C-level executives to track the status of the organization against KPIs. Updated on a recurring basis, it gives an overview of the business’ top-line performance in one neat page.
Analytical Dashboards
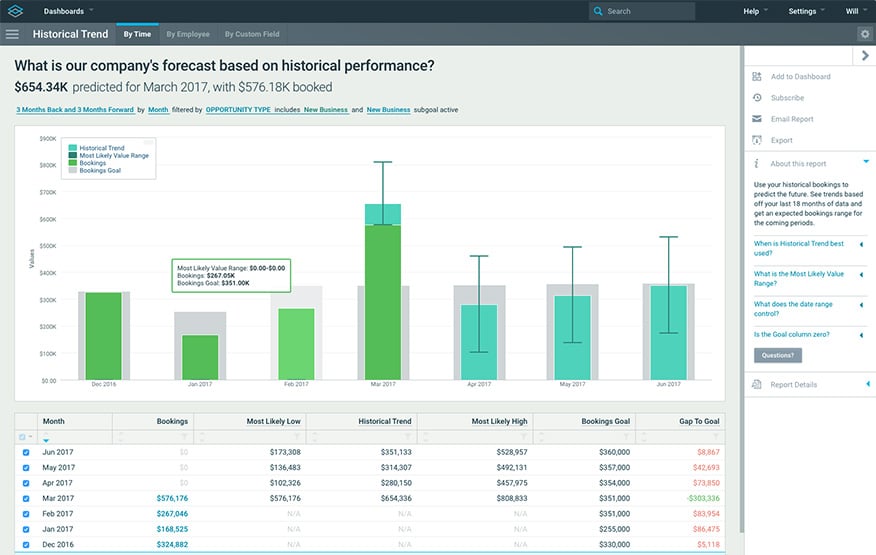
Analytical dashboards are smart. They analyze large volumes of data, allowing its users to forecast future trends and discover insights. An analytical dashboard is a powerful reporting tool, meant to help organizations make better informed, data-driven decisions based on insights into historical data. This type of dashboard can often be found in business intelligence tools, typically designed by seasoned data analysts.
—
Phew – ليس معقدا للغاية أليس كذلك؟
للبدء في رحلة البيانات الخاصة بك ، من المهم إلقاء نظرة على البيانات الموجودة وتحديد الحاجة. عندها فقط يمكننا تحديد نوع المخططات ولوحة المعلومات اللازمة لتمثيل النتيجة المرجوة على أفضل وجه ، مع إضافة الحسابات السردية والتفاعلية والتحليلية إلى هذا المزيج.
حافظ على الأساسيات في تصور البيانات ولن تخطئ أبدا.


