


Data Visualization for Modern Marketing Workshop

Skill up your marketing team in data visualization, dashboard, and infographic design.

Get your brand analytics visualized and presented better.

A Marketing Workshop: Storytelling with Data

Modern marketing teams are expected to be visual storytellers. They need to be fluent in analytics, comfortable with dashboards, and able to turn a wall of metrics into a story an executive can act on in minutes.

The Data Visualization for Modern Marketing Workshop gives your digital marketers the inside knowledge as to how to design marketing dashboards, how to aggregate insights from every channel into clear, visual reports, and how to choose the metrics that actually matter for their presentations — and their stories.

We’ll also cover where generative AI tools like ChatGPT, Claude, and Microsoft Copilot genuinely help with marketing reporting — and where they quietly make it worse.
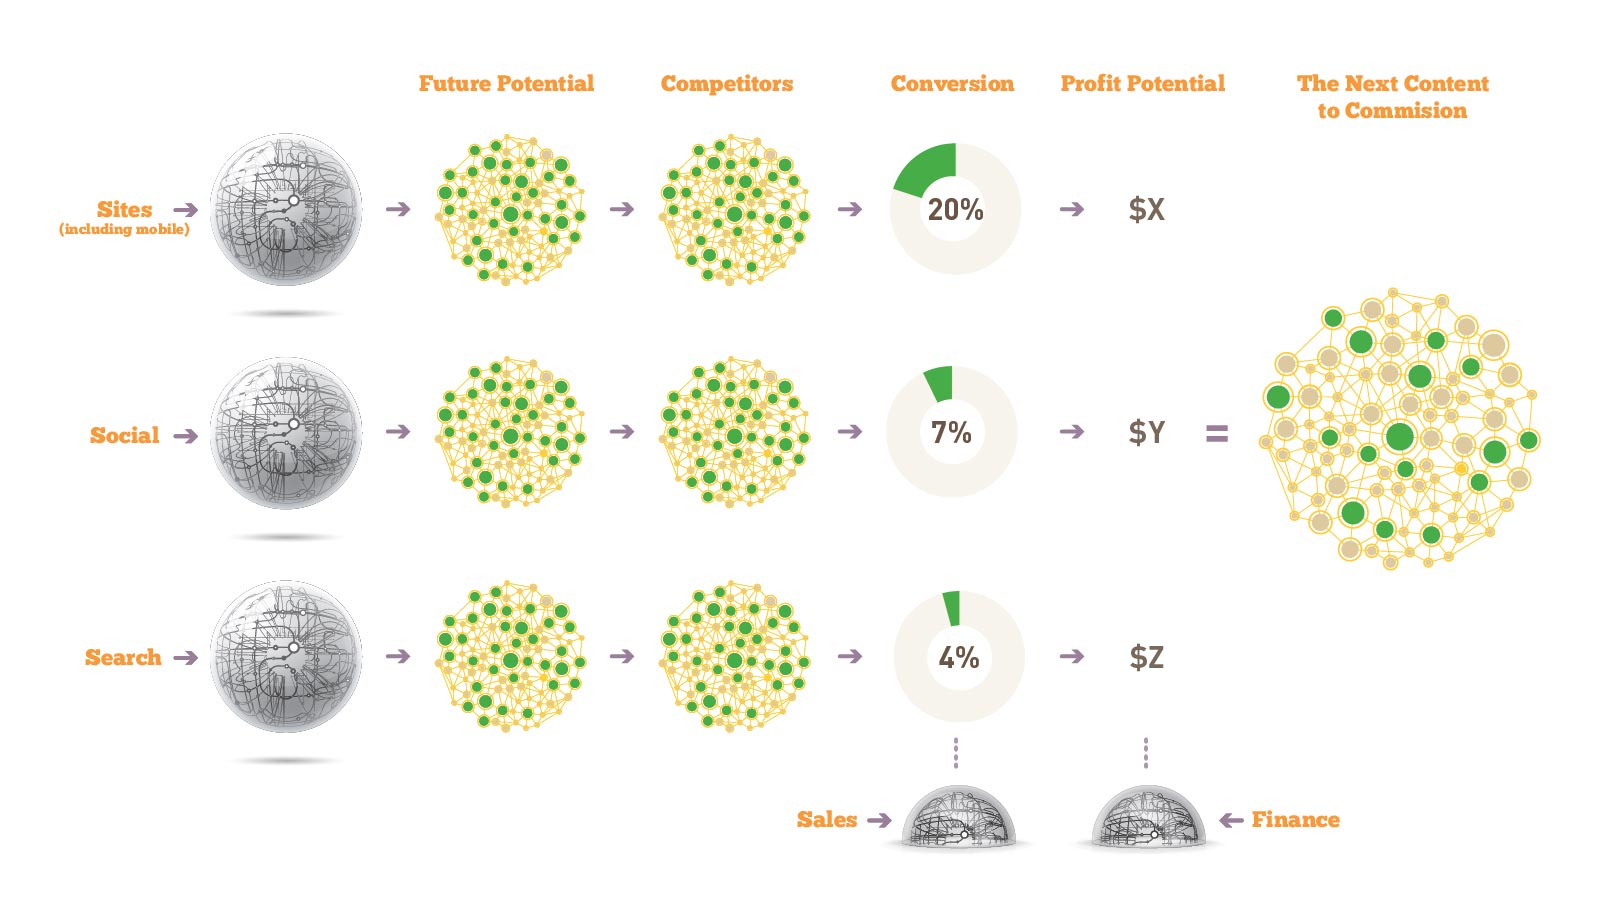
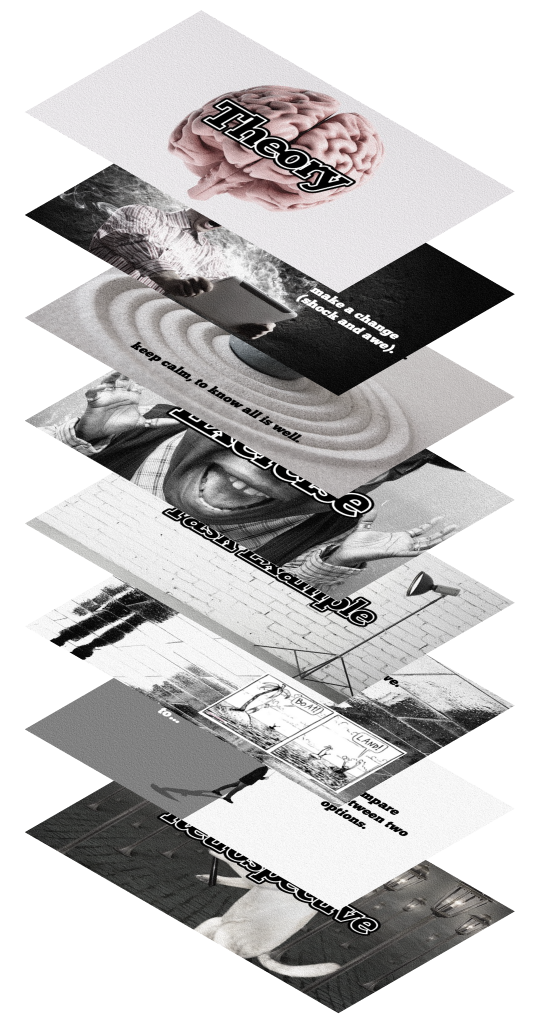
Image module

Data storytelling training for marketing teams

Raise the Bar for Your Marketing Reporting

The Data Visualization for Modern Marketing Workshop teaches marketing teams the skills to design dashboards, visual reports, and data stories.

Fun, interactive, and hands-on — this workshop will inspire your team to push for a new standard of marketing reporting. Here are eight things your marketers will learn:

Marketing Dashboards

See what a CMO dashboard should look like, and design channel and campaign dashboards your executives will actually read.

Choosing Metrics That Matter

Cut vanity metrics. Map where your marketing data comes from and arrive at the numbers that drive your business.

Chart Types for Marketers

Funnel, cohort, trend, and comparison charts — which chart fits which marketing question, and how generative AI can help.

Aggregating Channel Data

Bring SEO, Google Ads, GA4, email, marketing automation, and social media data together into one simplified, designed view.

Visualizing Risk & Trends

Show alerts, downward trends, and campaign risk clearly — so leadership sees problems early.

Infographic Campaign Reports

Turn monthly and quarterly reporting into visual reports and infographics stakeholders look forward to.

Data Storytelling for Presentations

Structure a campaign narrative: from raw analytics to a boardroom-ready story with a recommendation.

Templates & Workflow

Scale your team’s reporting with dashboard grids, report templates, and a repeatable design workflow.

The Datalabs Agency is a creative data design and visual analytics agency.

Data Visualization Experts, Specialists in Marketing

Image module

Our data visualizers have designed marketing data tools, interactive experiences, and analytics dashboards for enterprise and government clients over the years. We’ve seen the types of data, the varied software tools and the expanding data sets that modern marketers are now tasked with. The techniques we’ve put into the Data Visualisation for Modern Marketing Workshop have been used in data designs for companies, such as BlackRock, Marriott Hotels, CommBank, SEEK, iSelect, Monash University, NAB, Accenture, ANZ, Adelaide Crows, City of Melbourne, and Maurice Blackburn.

In training your marketing team, Datalabs will look at your existing way of reporting. We’ll workshop better, more visual methods to communicate marketing success and show ways to visualize risk, alerts, and downward trending metrics effectively, saving your marketing executives time in understanding how your larger marketing system is performing.

What You’ll See and Do in the Workshop

See for yourselves how great marketing teams are visualizing their data. See what a Chief Marketing Officer (CMO) dashboard should look like. Finally understand how data from SEO, email newsletters, AdWords, marketing automation software, and social media can be aggregated, simplified, and designed beautifully.

We’ll look at the complexity of marketing systems, the silos of data, and the constant inflows from social media and web analytics.

Rethinking Marketing Metrics

To take on these new challenges, modern marketing needs new thinking: visual thinking. Together, Datalabs’ data visualizers will help map with workshop attendees where your company’s marketing data is coming from, arrive at the important marketing metrics that drive your company, and with our data visualization methodology, workshop attendees will then design their own interfaces, infographic reports, and dashboards.

Report & Present Like a Modern Marketer

Where marketing data meets design and storytelling, the Data Visualisation for Modern Marketing Workshop aims to inspire marketers who want to improve their skills now. This workshop is geared for companies and government agencies, with every private workshop covering up to 12 attendees. Individual tutoring is available for executive-level employees only (C-Suite, Directors, and above). Availability is limited. The Workshop is designed to run for four hours.

Contact the Datalabs Agency about hosting this workshop for your marketing team today.

Hire a professional infographic designer...

Who Teaches the Marketing Workshop?

Otto Ottinger

Managing Director
Otto Ottinger Data Visualization Bio Photo
Otto is the Datalabs Agency’s Managing Director. Having learned his data visualization skills whilst working at National Geographic, Otto now serves as the Senior Instructor and Strategist for large client engagements, holding workshops with such companies as Marriott Hotels, Al Jazeera, eBay, and the Reserve Bank of Australia.

Testimonials & client endorsements...

WHAT OUR CLIENTS SAY

The Datalabs Agency launched it’s first interactive data visualisation in 2011. Since then, we’ve kept in touch with many of our clients from all over the world. Here what some of them have to say about us.

Questions & Answers

The Marketing Workshop

A mix of classroom-style teaching, theory, and hands-on exercises designed to get participants into the headspace of a data-literate marketer — not just a tool demo. Attendees work with their own reporting challenges where possible.

Digital marketers, marketing managers, content and social teams, analysts, and CMOs — anyone who has to turn campaign numbers into something a stakeholder will understand. No design background is assumed.

A full day runs about seven hours, a half-day four hours. A private workshop costs between $4,600 and $7,500 inc GST depending on length and delivery format, and every price covers up to 12 attendees.

Yes. On-site sessions are delivered at your offices; remote sessions run live on Zoom, Microsoft Teams, or Webex, and a remote full day can be split over two mornings for teams across time zones.

The Data Visualization & Storytelling workbook in digital or printed form, 70 dashboard grid templates and 18 downloadable dashboard icons, with the agenda tailored from around 16 workshop topics — weighted toward the marketing topics your team needs most.

Advance your team’s marketing skills with a workshop.
Gain the expertise for visualizing marketing data for analysis and reporting.

Contact Datalabs today and inquire about or data visualization for marketing workshop for your staff!

"*" indicates required fields

This field is for validation purposes and should be left unchanged.
Name*