We take a strategic, consultative look at your Tableau dashboards and report structures.
The Datalabs Agency uses data visualization and UI/UX design processes to understand your reporting systems, then apply best practice data visualization techniques to ensure your Tableau reporting infrastructure is world class.
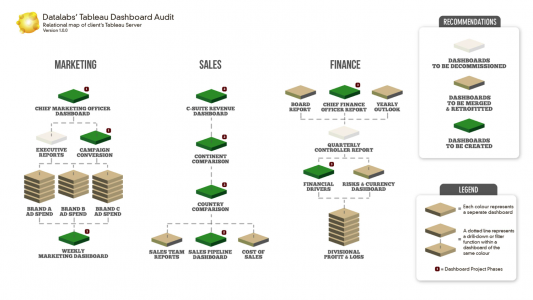
[lightbox type=”image” title=”Part of Datalabs Tableau consultancy service: the Tableau Dashboard Relational Map, an infographic of your dashboard assets — present and future — and our recommendations for action.” href=”https://staging.datalabsagency.com/wp-content/uploads/2017/02/Datalabs-Tableau-Dashboard-Audit-Service-1000px-1.jpg” width=”400″ height=”150″][/lightbox]
Click to expand.
Our process:
Our process is to forensically examine your Tableau visual reporting system, often found on Tableau Server. We test and review existing workbooks and recommend changes. Often the result is a straight-to-the-point critique — a detailed, visual document advising business intelligence or analyst managers on the need to rework, combine or decommission redundant dashboards. Here’s what the Datalabs Agency offers:
A Dashboard Audit
A Thorough Review of What’s There, What’s Working, & What’s Not
More exciting and less intrusive as it sounds, the Datalabs Agency’s Dashboard Audit allows your company to get an independent review of your current designs. We’re creative data visualizers and user experience experts. Our focus with our Audit is the visualization of the relationships between your company’s dashboards already on Tableau Server or Tableau Online. We’ll make strategic recommendations, advising which dashboards should be re-visualised, which should be deleted altogether, and what’s already best-practice data design.
A Tableau Style Guide
Datalabs’ Tableau Style Guide
A Visual Plan — on Brand — for Your Dashboards in the Future
Before your team goes too far — what’s your company’s design style and user experience plan for Tableau? Too often, it’s the job of the analysts to be dashboard designers.
That never ends well.
So before your team checks in a few years’ worth of dashboards of differing quality and questionable design, get a visual plan — a Tableau Style Guide from the Datalabs Agency. We can work with your company’s Brand Manager and with your existing Style Guide to produce a data visualization style guide specifically for Tableau.
A Dashboard Retrofit
Re-skin, Re-visualise, Re-do
Are you disappointed with the Tableau dashboards you have today? Do they have different designs, user experiences, and are generally ‘all over the place’? Don’t waste your already considerable investment of time, money, and resources. Using a common Tableau style guide, the Datalabs Agency can re-design, re-visualise your suite of existing dashboards in new layouts, giving them a common look-and-feel and interactivity.
New Creative Designs
Experience Tableau Through the Eyes of an Expert Data Visualiser
See the future of Tableau dashboards. The Datalabs Agency isn’t your typical IT consultancy or business intelligence consultant, we’re data visualizers with a love for interactive design. Our team of Tableau experts can work directly with your executive team to sketch out the interface designs, the charts and graphs, and the equations, drill-downs, and tool tip for your next generation of Tableau dashboards.


 [/lightbox]
 A Dashboard Retrofit