


Wir haben eine Liste interaktiver Datenvisualisierungen zusammengestellt, die Ihnen hoffentlich als Anregung dienen, es selbst zu versuchen. Mögen Ihre Daten nie langweilig sein.
An all-in-one package containing tools, guidance, and assets to design great dashboards
$495.00 – $1,141.00
Finally, a course that shows you what you need to know.
Original price was: $136.00.$69.00Current price is: $69.00.
Get trained to visualize data and tell better stories.
Original price was: $136.00.$69.00Current price is: $69.00.

Der Data Analytics Conferences Guide 2024/2025 ist Ihr One-Stop-Shop für Konferenzen, zu denen Sie tatsächlich gehen möchten. Das sind tolle Konferenzen in coolen Städten.

Sehen Sie sich den Leitfaden 2024/2025 zu den besten Datenvisualisierungskonferenzen in Nordamerika, Australien, Asien und Europa an. Nutzen Sie den diesjährigen Konferenzführer als Reiseplaner. Gehen Sie also raus, reisen Sie, lernen Sie neue Leute kennen und erfahren Sie mehr darüber, was die Datenvisualisierung zu einem so kreativen und interessanten Arbeitsbereich macht.
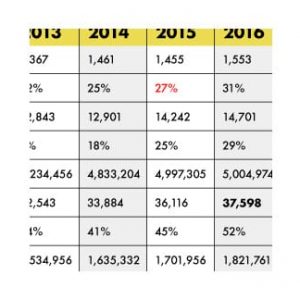
Verwenden Sie keine Tabellen mehr in Ihren Berichten. Im Ernst, es gibt bessere Möglichkeiten, Daten zu visualisieren. Hier sind drei: »
An all-in-one package containing tools, guidance, and assets to design great dashboards
$495.00 – $1,141.00
Finally, a course that shows you what you need to know.
Original price was: $136.00.$69.00Current price is: $69.00.


Get the best grids, layouts, navigation, and UI components for your dashboards.
$1,202.00 – $2,114.00
Get trained to visualize data and tell better stories.
Original price was: $136.00.$69.00Current price is: $69.00.
An all-in-one package containing tools, guidance, and assets to design great dashboards
$495.00 – $1,141.00
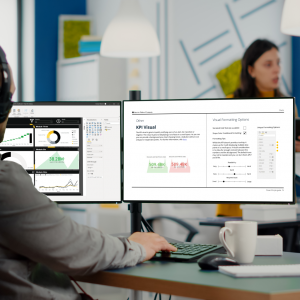
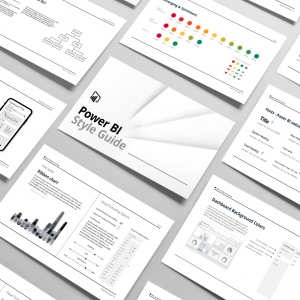
A visual Power BI theme (together with its JSON file) is the first step to go from good BI to great BI. It’s also the missing link in most business intelligence projects. When you work on any visual platform having a guide with parameters, styles, assets, rules, and examples is key to a smooth process and a clear style. Add to that the complexity of conveying a story with data or using the interface to show complex systems, then without a guide, it means that there is no consistency.
$495.00 – $1,141.00
Finally, a course that shows you what you need to know.
Original price was: $136.00.$69.00Current price is: $69.00.
Do you want to learn how to design beautiful dashboards?
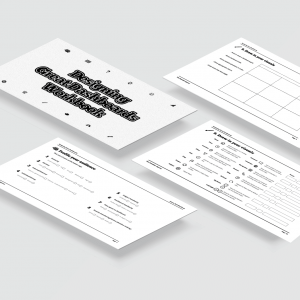
Designing Great Dashboards is the only course that will teach you the 12-step process for doing just that. It's easy to follow -- with step-by-step instructions and video tutorials that show you exactly what needs to be done for each step. This is the same dashboard training given by our data visualization agency to numerous Fortune 500 companies and government organizations around the world. Interested in more than just dashboard training? Then get access to:- 70 dashboard grid templates
- 18 downloadable dashboard icons
- and an interactive workbook.
Original price was: $136.00.$69.00Current price is: $69.00.
Get the best grids, layouts, navigation, and UI components for your dashboards.
$1,202.00 – $2,114.00
Are you tired of spending hours creating a dashboard from scratch?
Using the same chart types over and over again is boring, and it's time-consuming to create them from scratch every time you need one.
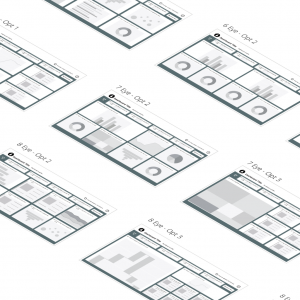
Imagine having 42 pre-made templates, designed by our professional data visualizers. Each template is ready for your data in just a few clicks. Each template has been designed with specific chart placeholders that match up perfectly with each other, so you can easily customize them to fit your brand colors and fonts.
Our Power BI Templates are easy-to-use tools for creating stunning dashboards fast. They come preloaded with chart placeholders that match up perfectly with each individual layout - no more guesswork or trial-and-error design needed!
$1,202.00 – $2,114.00
Get trained to visualize data and tell better stories.
Original price was: $136.00.$69.00Current price is: $69.00.
Skill-up now with a data visualization course that packs together creativity, design, and storytelling in a series of fun-to-follow videos.
If you work with data, we guarantee you’ll get something out of the Introduction to Data Visualization & Storytelling course. Whether you’re a marketer, designer, web developer, data analyst, or public servant, you’ll be able to take away practical skills to better communicate data in your day-to-day.
● This course is built for EVERYONE
● You don’t need to be a data viz software wiz
● You don’t need to be a designer
● You DO have the time - complete the course in as little as 10 hours
● Learn on the go – whenever and wherever you have an internet connection
Original price was: $136.00.$69.00Current price is: $69.00.
An all-in-one package containing tools, guidance, and assets to design great dashboards
$495.00 – $1,141.00
A visual Power BI theme (together with its JSON file) is the first step to go from good BI to great BI. It’s also the missing link in most business intelligence projects. When you work on any visual platform having a guide with parameters, styles, assets, rules, and examples is key to a smooth process and a clear style. Add to that the complexity of conveying a story with data or using the interface to show complex systems, then without a guide, it means that there is no consistency.
Finally, a course that shows you what you need to know.
Original price was: $136.00.$69.00Current price is: $69.00.
Do you want to learn how to design beautiful dashboards?
Designing Great Dashboards is the only course that will teach you the 12-step process for doing just that. It's easy to follow -- with step-by-step instructions and video tutorials that show you exactly what needs to be done for each step. This is the same dashboard training given by our data visualization agency to numerous Fortune 500 companies and government organizations around the world. Interested in more than just dashboard training? Then get access to:- 70 dashboard grid templates
- 18 downloadable dashboard icons
- and an interactive workbook.
Get the best grids, layouts, navigation, and UI components for your dashboards.
$1,202.00 – $2,114.00
Are you tired of spending hours creating a dashboard from scratch?
Using the same chart types over and over again is boring, and it's time-consuming to create them from scratch every time you need one.
Imagine having 42 pre-made templates, designed by our professional data visualizers. Each template is ready for your data in just a few clicks. Each template has been designed with specific chart placeholders that match up perfectly with each other, so you can easily customize them to fit your brand colors and fonts.
Our Power BI Templates are easy-to-use tools for creating stunning dashboards fast. They come preloaded with chart placeholders that match up perfectly with each individual layout - no more guesswork or trial-and-error design needed!
Get trained to visualize data and tell better stories.
Original price was: $136.00.$69.00Current price is: $69.00.
Skill-up now with a data visualization course that packs together creativity, design, and storytelling in a series of fun-to-follow videos.
If you work with data, we guarantee you’ll get something out of the Introduction to Data Visualization & Storytelling course. Whether you’re a marketer, designer, web developer, data analyst, or public servant, you’ll be able to take away practical skills to better communicate data in your day-to-day.
● This course is built for EVERYONE
● You don’t need to be a data viz software wiz
● You don’t need to be a designer
● You DO have the time - complete the course in as little as 10 hours
● Learn on the go – whenever and wherever you have an internet connection


