

Formalise your company’s approach to reporting through infographic reports, motion graphics, animated data videos, interactive data visualisation, digital imagery, and printable reports.
Visual Reporting Strategies
Get a plan to revolutionize and streamline your data-driven reporting.
Beautifully and Intuitively Report Data Insights With a Visual Reporting Strategy
Who Needs a Visual Reporting Strategy?
Companies and government departments that produce a lot of reports or are undergoing transformation initiatives and need to sort out an engaging visual framework to get their data understood.
What Problems Do Visual Reporting Strategies Solve?
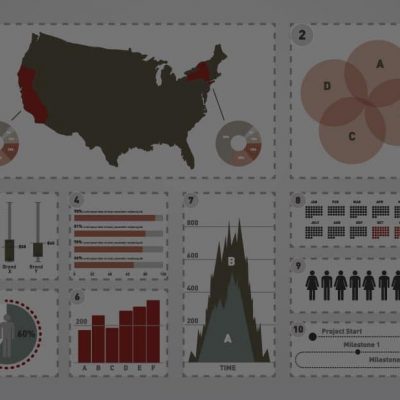
A lot of companies we help say that their reports aren’t even used at all. They’re repetitive, flat, dense, and ugly. They miss the mark. Key stakeholders have ceased using them, often bypassing the official reports on a quest for better data or someone who can tell them the answers to their questions. A Visual Reporting Strategy solves this engagement problem, while at the same time forecasting the need for interactive dashboards, infographic reports, and PowerPoint templates to get all stakeholders into the data, seeing as a group the key insights.
What Future Value Do Visual Reporting Strategies Give?
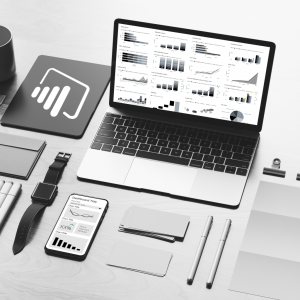
Imagine teams taking seeing a visual system of just insights. Imagine executives taking action, using accurate data, seizing opportunities and minimising risks (or avoiding them altogether!). Visual reporting and best practice data visualization are competitive advantages. Retrofit and expand upon your reports, bring them into the 21st Century, away from Excel, make them interactive, and design them to be simple, intuitive, and beautiful.
What’s In Datalabs’ Visual Reporting Strategy?
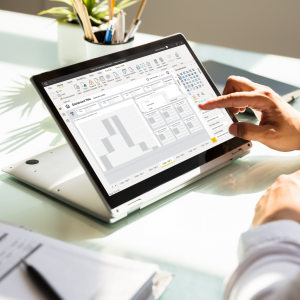
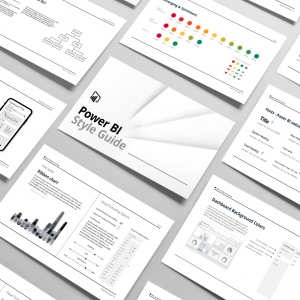
Data Visualization Style Guides: Microsoft Excel, Dashboards (either Tableau or Microsoft Power BI business intelligence tools)
Visual Strategy Pack: A highly visual plan that re-imagines your organization’s reporting from the ground-up. We audit existing reports, assist in the transformation from legacy tools like Excel to highly interactive ones, and visualize the exciting future of real-time predictive and predictive data. We’ll also work with top executives on obtaining the dashboard systems that drive their business, the way they imagine it and lines up with their KPIs and the wider company goals.
Get time with our skilled data visualization consultants. Tap into a diverse skillset of data design, user experience, and visual storytelling. We utilize data visualizers, project managers, business intelligence developers, and visual strategists to pull together a Visual Reporting Strategy that is custom to your organization.
Looking to Sweep Your Old Reports and Reporting Processes Out the Door?
Get in touch with us about beautifying your reporting, migrating to the right business intelligence software, and/or automating your reports. We can set you on the right path!


What’s Not to Like About Visual Reporting?
Find the intelligence that's been obscured in your data.

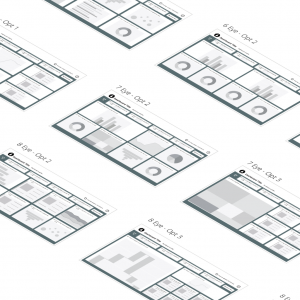
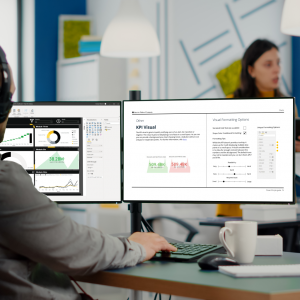
Get the best grids, layouts, navigation, and UI components for your dashboards.
$195 – $790
An all-in-one package containing tools, guidance, and assets to design great dashboards
$900 – $3,900