

We focus on creativity, the user experience, and a 12-step process in this dashboard training workshop. Take a look at a few topics we cover…
Designing Great Business Dashboards Workshop
Get the skills you need to design professional dashboards.
What Makes a Great Dashboard Design Workshop?
It's not the software you use. It's your thinking and decision-making processes.
Designing Dashboards for Your Audience
Really understand the person or group of people you are designing for. Let’s look at methods to do just that.
The Best Insights
Stop visualizing numbers. Your audience wants answers, context, and a sophisticated story designed for them.
The Greatest in Dashboard Grids & Templates
Regardless of whether you use Tableau or Power BI, you should be using grids and templates.
Getting Your UI Right for a Great UX
What are the possibilities for laying out your dashboard’s user interface? Let’s look at some real-world examples.

Define Your Dashboard's Objective
What’s the point of your dashboard?! We’ll show you the types of dashboard objectives you can work with.
Reds, Greens, & the Importance of Color
Let’s review best-practices for dashboard color palettes before we design our first pixel.
Storytelling & Insights
Dashboards aren’t the strongest storytellers in data visualization. However, the insights inside them can make them memorable.
Tips & Tricks for Great Dashboard Design
Icons, diagrams, interactivity, and influences — we give our professional advice for better data design.
Do you want a design process used by professional data visualizers?
Discover the basics of designing dashboards, from understanding your audience and drawing out a good grid for data to asking questions that will lead you toward greater insights. Learn how human emotions can be used in charts’ stories, as well as new methods for choosing what type of chart is best for your data. Then you’re free to bring your designs into software like Power BI, Excel, or Tableau. Our visual process teaches you that your designs and pre-work make great dashboards; BI software is the last step So if you’ve been dreaming about making your own awesome-looking dashboards, this course is perfect for you. With eye-popping visuals throughout and easy-to-understand exercises that take your dashboards from basic to impressive, it will teach you how to impress your boss and your colleagues with data visualization and storytelling.
Get the skills, no matter what software.
Do I need to be an expert at Excel, Power BI, or Tableau?
Not at all. With the Datalabs Agency’s Designing Great Dashboards Course, you’ll be trained on how to take your dashboard design to the next level. But pencil and paper are all you need. Learn how to strategically set up your dashboard to ask specific questions and visualize insightful answers. Business intelligence dashboards are a widely-used and highly effective medium for visualizing data. However, the mistakes data analysts and data scientists often make are in the steps before visualizing the data in a Power BI or Tableau. Sketch out your ideas, fail fast, and revise — that’s what we believe and teach. Once you and your dashboard’s audiences are happy — then you can start to develop your designs in any software. Our data design process is software agnostic — meaning you don’t need to be a Tableau or Power BI wizard to get the full benefit of this course.
STOP DESIGNING DASHBOARDS AS YOU HAVE BEEN
WE OFFER THREE DIFFERENT DASHBOARD WORKSHOPS
What Makes This Dashboard Workshop Different?
Most dashboard design books and training courses are created by academics or those that have limited real-world experience. Our data visualization agency has seen the same mistakes made over and over again, so we decided to create this course that cuts straight to the point. This course isn’t based on theory or academic research – it’s based on our own experience working with hundreds of companies in dozens of industries. This is the only course you’ll need if you’re looking for an easy-to-follow process for designing dashboards from scratch. While we might show the creation of a fully functioning dashboard in Microsoft Power BI, we designed it for everybody, regardless of tool and expertise. It works whether you’re new to data visualization or just want to learn a better method for designing BI dashboards.
How long is the Intro to Data Viz workshop?
In total, four hours — we offer it in two two-hour sessions or one half-day block.
What are the recommended number attendees per workshop?
We find it works best to have between 5 and 20 attendees per workshop.
How does the Datalabs Agency teach the workshop?
Either via Microsoft Teams or Zoom. On-site workshops are possible, too. Inquire in the form below.
How much does a typical workshop cost?
It depends. We can price our data visualization workshops by the number of attendees or on a per workshop basis, whichever is cheaper for you. Contact us for an estimate.
Tell me more about this workshop...
What are the Learning Outcomes of This Dashboard Training?
At the end of our end of the Designing Great Dashboards Workshop, you’ll have a process for designing your own BI dashboards, regardless of whether you use Excel, Tableau, or Power BI.
- You’ll be knowledgeable about how to arrive at higher-level insights and use new techniques to plan and execute a single BI dashboard.
- Attendees will leave with a professional understanding of how data visualization, visual analytics, and user experience design combine to create useful and practical dashboards.
- In addition, a portion of the workshop is dedicated to forming better business questions, questions that your dashboard’s audience continuously asks (or should ask), and questions that will help simplify and glean insights from your data.
- Attendees will then have the ability to prepare their own dashboard project, redesign/retrofit dashboards, and understand the power of users’ feedback in the design process.
- Finally, our facilitators will showcase new data visualization influences and resources that your team can use to inspire your next round of dashboard designs.
And that's not all...
Interested in More Than Just Dashboard Training?
Then get access to 70 dashboard grid templates, 18 downloadable dashboard icons, and an interactive workbook. It’s all yours and it’s all possible with your dashboard workshop.
The real question is...
Want to Learn How to Design Beautiful Dashboards?
Designing Great Dashboards is the only workshop that will teach you and your team the 12-step process for doing just that. It’s easy to follow — with step-by-step instructions by an expert facilitator who instructs you on exactly what needs to be done at each step. This is the same training given by our data visualization agency to numerous Fortune 500 companies and government organizations around the world.


WHAT OUR CLIENTS SAY
The Datalabs Agency launched it's first interactive data visualisation in 2011. Since then, we've kept in touch with many of our clients from all over the world. Here what some of them have to say about us.
Add to Your Dashboard Workshop Experience
A digital or printed version of the Data Visualization & Storytelling Workbook is available...
Designing dashboards is not easy. It takes years of practice and patience to master the art. This workbook features the 12-step process for designing great dashboards. It’s designed for all workshop attendees, whether they’re analysts, executives, or graphic design professionals.In the workbook, we’ve captured the best learning modules from our data visualization courses.
You’ll learn how to design data visualizations, tell stories with data, choose charts and graphics that work well together, and understand the end-to-end process of dashboard design – from start to finish. Storytelling with data is now expected in many fields and industries. Designed by the Datalabs Agency, this workbook contains the key resources for this dashboard workshop that will influence the skills of you and your colleagues for years to come.
The Designing Great Business Dashboards Workshop Can Be Customized
Every group is different and has unique strengths and weaknesses when it comes to designing BI dashboards. We have trained over 80 companies and government organizations. So we’ve seen it all. Ask about how we can sculpt a dashboard workshop that solves your team’s challenges.
In addition, this workshop can be customized for different audiences or skill levels. Exercises in the workshop can be rejigged to use your data, the data your employees are now working with, whether in Tableau or Microsoft Power BI. So get in touch with us and inquire about customizing your dashboard workshop.
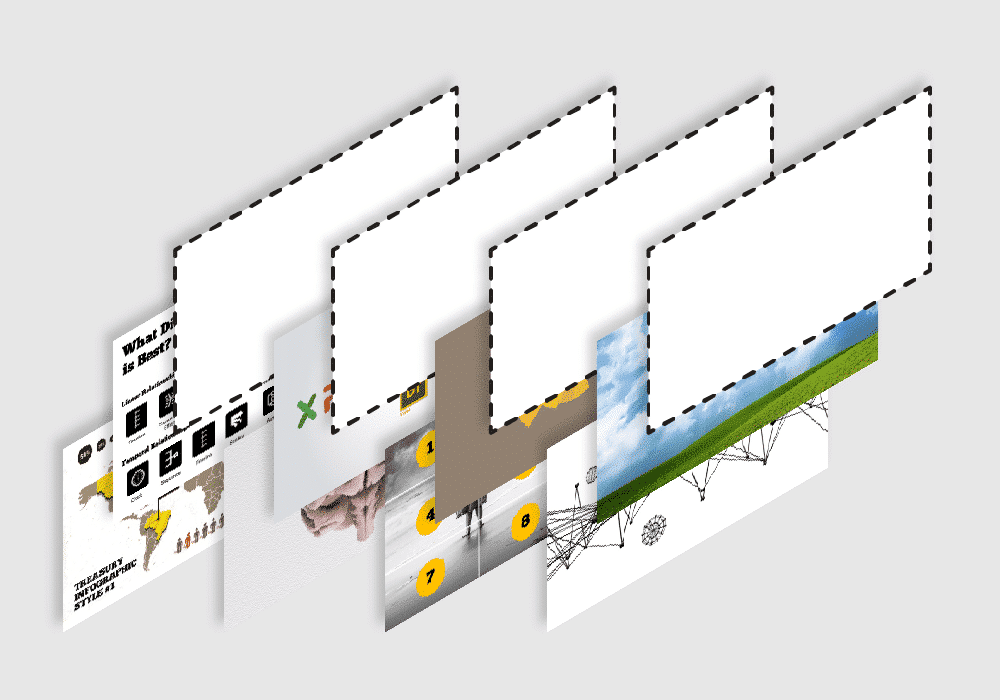
See What ‘Extras’ Come With Our Data Visualization Workshops…

Book your workshop or take the online course today!


Get expert advice on data visualization from our agency's Managing Director.
From: $150


Who Facilitates Our Data Visualization Workshops?
Otto Ottinger
Managing Director

Otto is the Datalabs Agency’s Managing Director. Having learned his data visualization skills whilst working at National Geographic, Otto now serves as the Senior Instructor and Strategist for large client engagements, holding workshops with such companies as Marriott Hotels, Al Jazeera, eBay, and the Reserve Bank of Australia.