

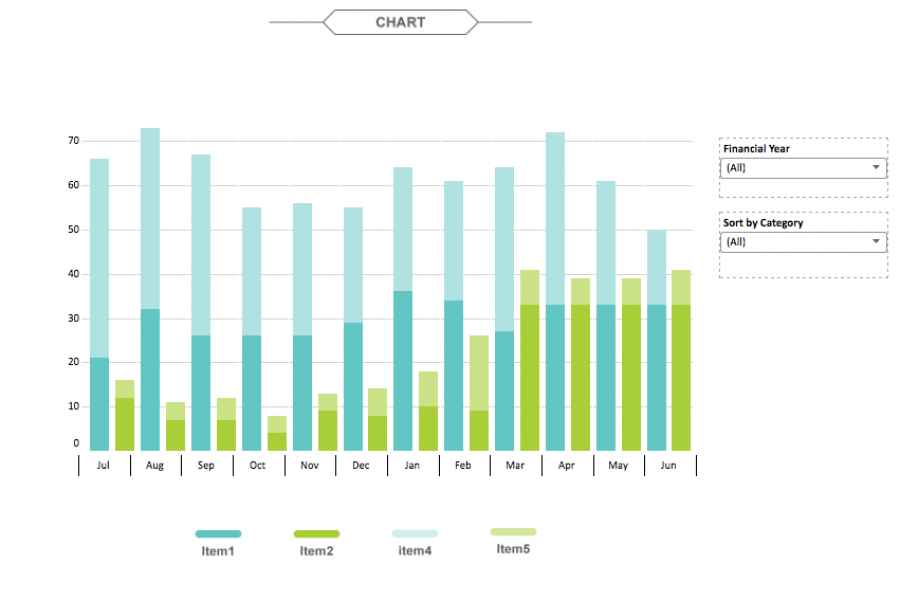
The aim for this project was to create an interactive dashboard, utilizing Tableau, to convey the data that had been collected over the financial year. Check out this financial firm's reporting suite.
Interactive Infographic Dashboards: 5 Ways A Great Dashboard Can Optimize Your Business Operations. Business leaders employ numerous tools to track operational progress and strategically plan future campaigns. It is not

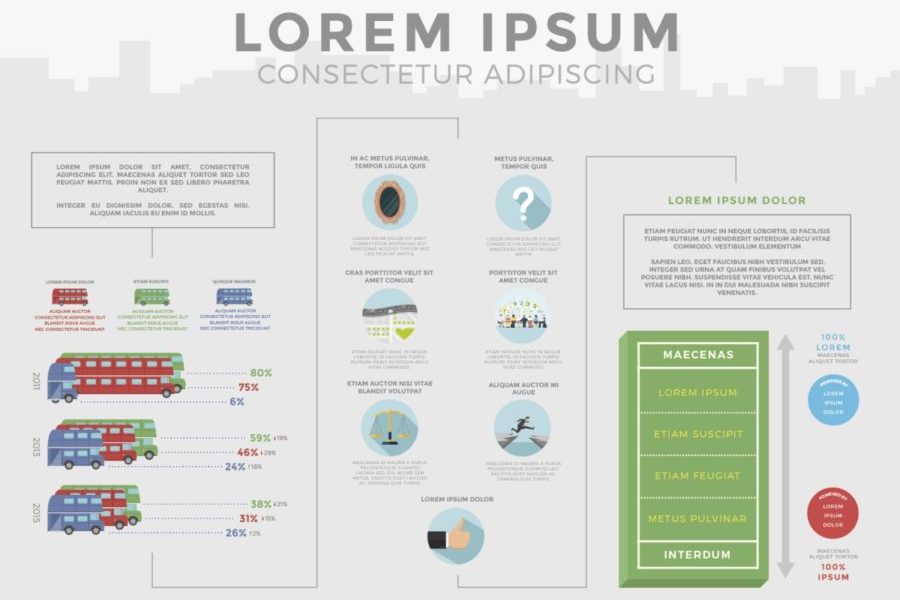
Case Study: A Long Infographic Report Design We recreated a long research report with an infographic style, using charts and graphs to convey the data they’d collected, over the period

Excel Data Visualization Artwork Project. Creating beautiful, artistic work exclusively in Excel. We were tasked by a digital agency to create something different for their client, using only the Microsoft product

Examples of Digital Annual Reports That Don’t Suck A handful of forward-thinking companies and non-profits have begun to turn the routine production of a digital annual report into an opportunity
A large Australian and New Zealand food manufacturer engaged Datalabs to visualize a set of survey results undertaken by their human resources department and an external consultancy. The result was this visually engaging infographic.

Empowering Employees to Make Better Decisions Through Visual Analytics. “Seeing is believing, but sometimes the most real things in the world are the things we can’t see”, – The Polar

4 Challenges Facing Business & Data Analysts Right Now “Without big data analytics, companies are blind and deaf, wandering out onto the web like deer on a freeway.” – Geoffrey Moore

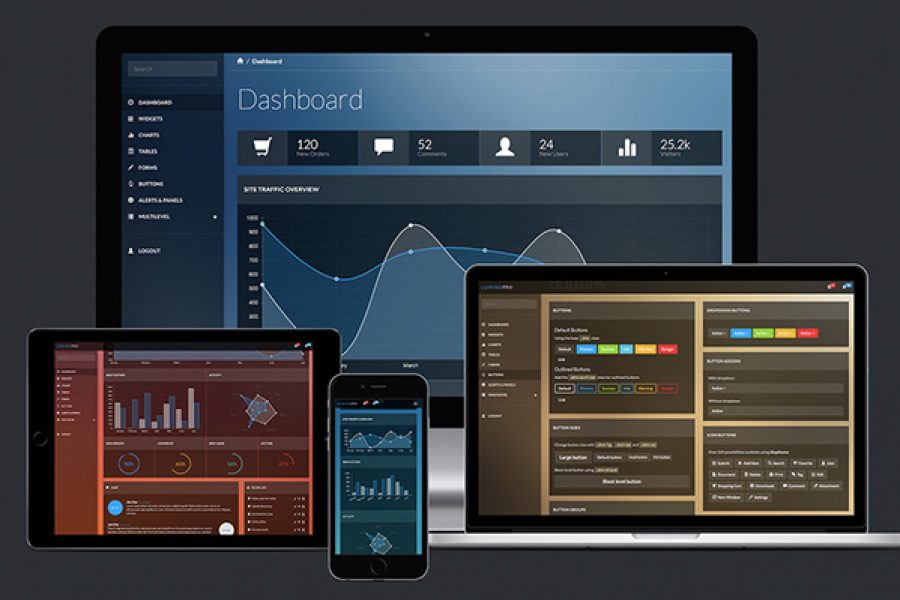
See Tableau dashboards examples in the wild. We've tracked down the best example of dashboard design done in Tableau. Get inspired.
4 Marketing Analytics Trends That Will Kill It In 2016 As digital marketing continues to evolve and marketers gear up for 2016, here are the 4 analytics trends that we
2 Examples of Dashboards We Love and Why. To finish up the year, we thought we’d showcase a few dashboards that caught our collective eyes here at Datalabs HQ. There isn’t a
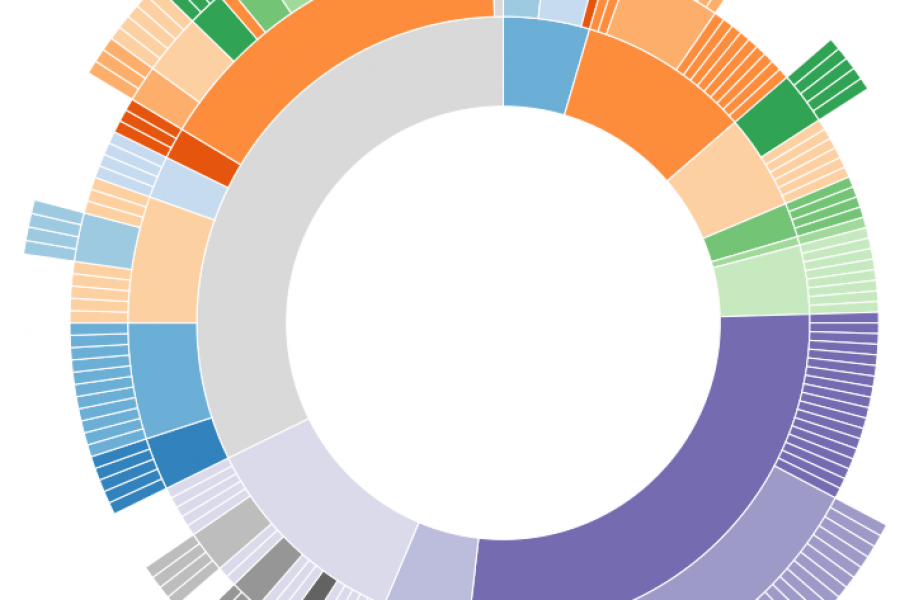
8 More Common Types of Data Visualization Following up on our previous list of 15 Types of Data Visualization, which you can find here, we’ve come up with 8 more