

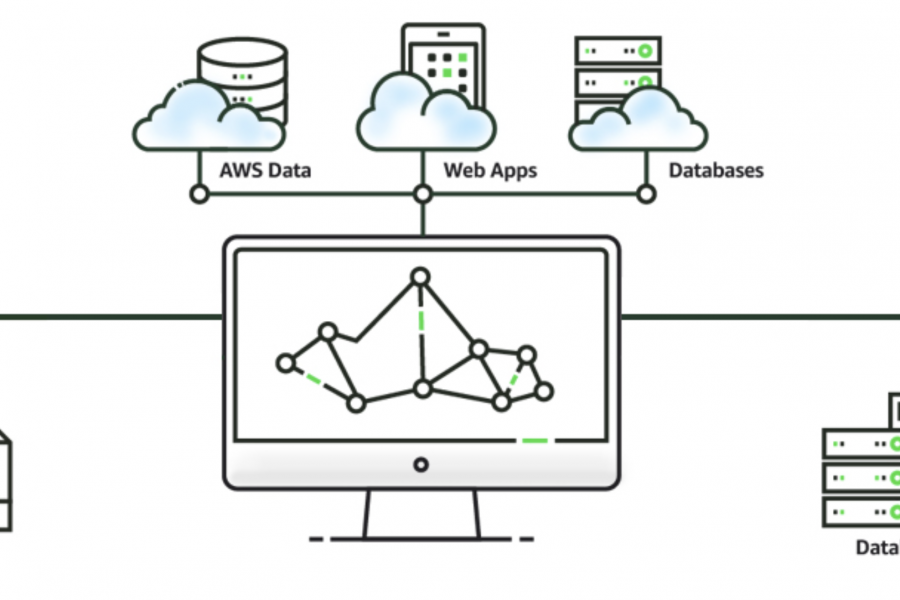
Business Intelligence Tools Amazon Web Services recently came out with a shiny new toy for us data enthusiasts — Amazon Quicksight. For those of you (also us) that’s already used
Data Visualization Brand Guidelines for Tableau, Microsoft Excel, Highcharts & Infographics As we have seen on projects time and time again, data scientists and data designers have two separate capabilities.

Data Visualization Websites — 101 of the Best Resources Ideas, inspiration blogs, people, tools, and more! We’ve searched and searched to bring you 101 data visualization websites that showcase the
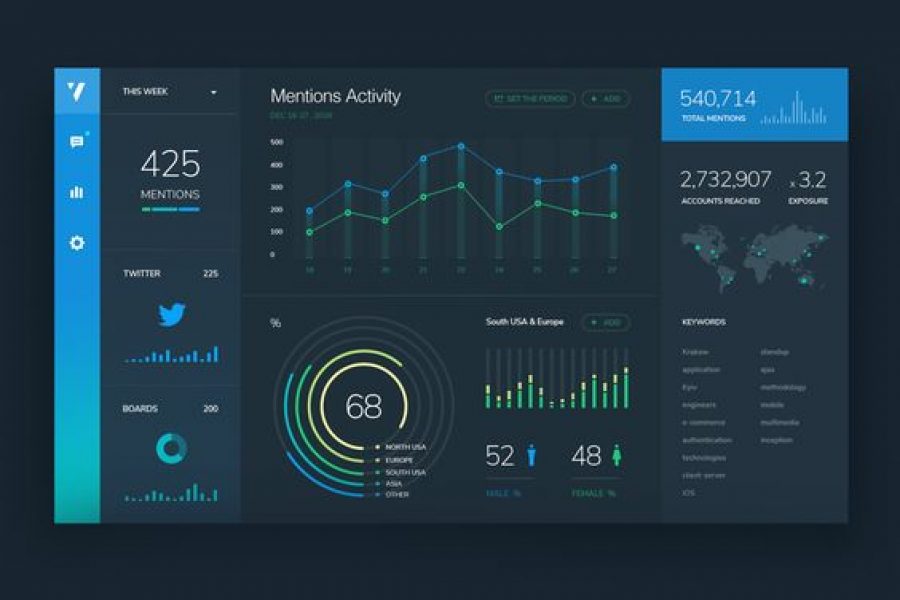
3 Pro Tips for Great Dashboard Design A strategic approach to visualizing your data through dashboard systems for humans. Here at Datalabs, we eagerly await the day computers gain sentience,